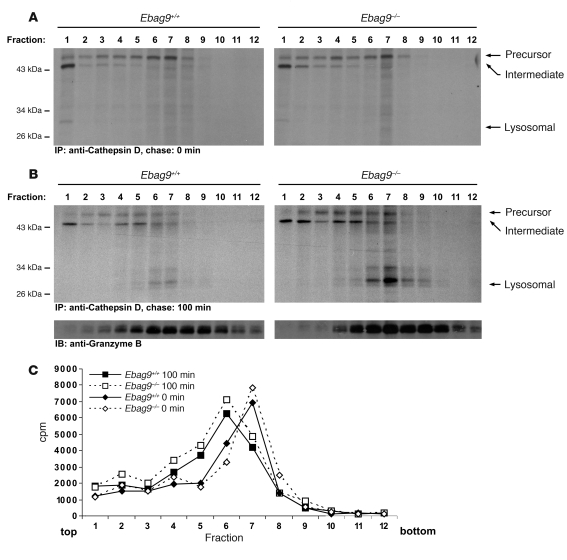
Figure 15. EBAG9 controls intracellular sorting and processing of cathepsin D.
(A and B) CTLs were pulse-labeled with 500 μCi [35S]methionine/cysteine for 15 minutes and chased for 0 minutes (A) and 100 minutes (B). A postnuclear supernatant was enriched for a light microsomal fraction, including lysosomes by centrifugation at 20,000 g for 20 minutes. Pellets were further resolved on a continuous OptiPrep gradient. Fractions (0.9 ml) were collected from the top of each gradient and lysed in an equal volume of 2× NP-40 lysis buffer, and aliquots were immunoprecipitated with a mixture of anti–cathepsin D antibodies. Samples were analyzed by SDS-PAGE. Aliquots of each fraction were precipitated with TCA and analyzed by immunoblot using a polyclonal anti–granzyme B serum. Data are representative of 2 experiments performed, with pooled CTLs from 6 mice per group. (C) Distribution of radioactivity along the gradients is shown.

