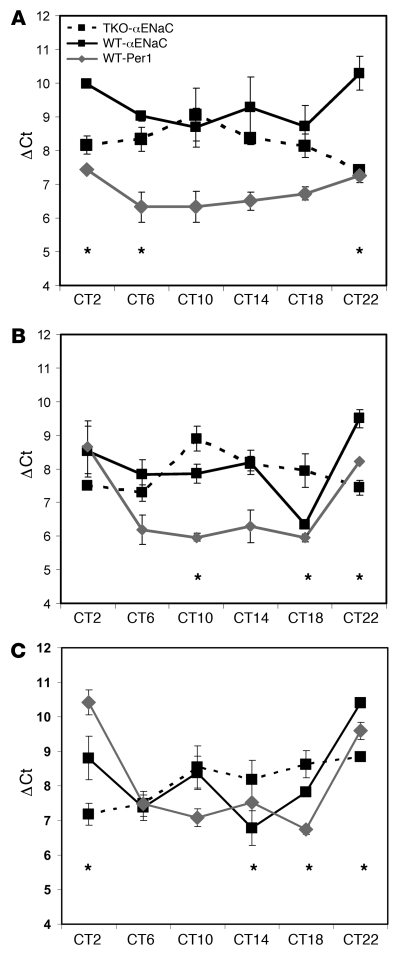
Figure 13. The expression profile of αENaC is altered in Period-deficient mice.
Inner medullas (A), outer medullas (B), and cortex (C) were dissected from 3 wild-type or 3 TKO mice that were euthanized every 4 hours over a 24-hour period. Total RNA was isolated and converted to cDNA for QPCR analysis. The data are expressed as the ΔCt value, which is a measure of expression relative to actin (higher ΔCt values correspond to lower expression; see ref. 49), versus the circadian time (CT2–CT22). Data are presented as mean ± SEM; n = 3 for each data point. *P < 0.05, wild-type αENaC expression versus TKO.

