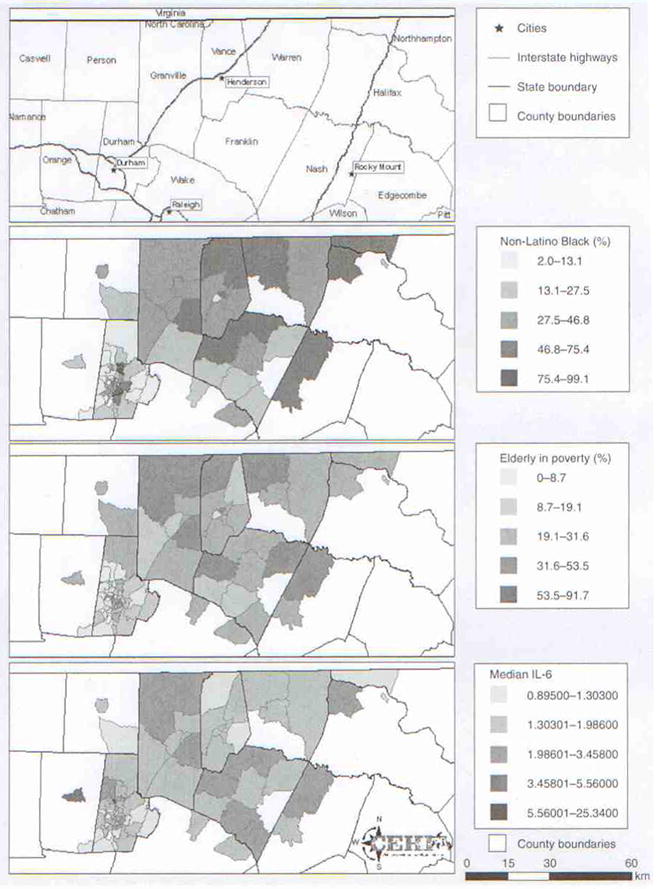
Figure 4. County and census tract boundaries for the study area in NC, USA.

Gradations in exposure distributions for the two primary variables of interest (non-Latino Black and age-associated poverty), and for median census tract IL-6. Graphical maps of descriptive data for census tract variables, census tract boundaries and interstate highway locations were created using ARCGIS software (version 9.1, Environmental Systems Research Institute, Inc., CA, USA).
