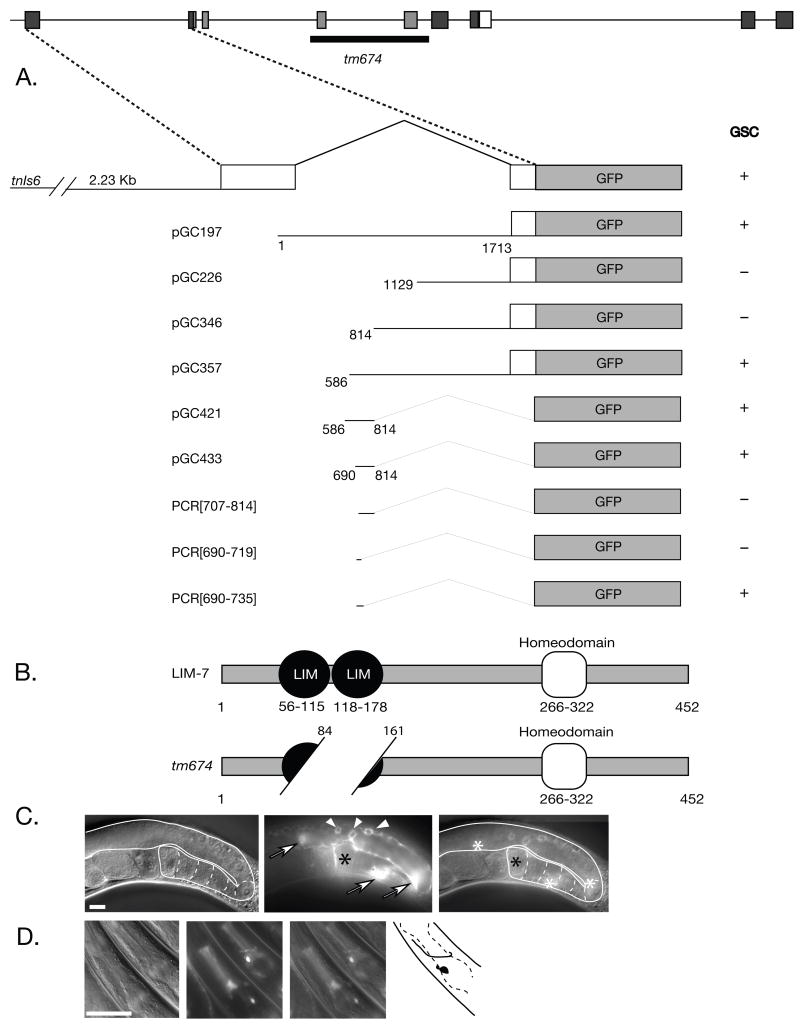
Figure 1. The lim-7 locus and reporter constructs, LIM-7 structure, and gonadal sheath expression of the Intron 1 element.
(A) Upper, lim-7 genomic structure. Black and white exons correspond to domains of LIM-homeodomain proteins depicted in (B): black, LIM-domains; and white, homeodomain; dark gray, non-domain sequences. Lower, intron 1 fusions to GFP. (+), expression in the gonadal sheath; (−), no expression in the gonadal sheath; numbering refers to nucleotides from the beginning of intron 1. (B) LIM-7 LIM-HD protein structure and predicted tm674 mutant protein structure. Color scheme as in (A). (C) Expression of pGC433 in the gonadal sheath. Gonad is outlined and maturing oocytes are outlined by dashed lines. Arrows indicate the nuclei of the thin gonadal sheath cells in plane of focus; arrowheads indicate germ cell nuclei surrounded by gonadal sheath (fluorescence comes from sheath); black asterisk marks the proximal end of the gonad, where sheath pair 5 is located (fluorescence to left of asterisk may be due to lim-7(+)::mCherry fluorescence in Sh5; white asterisks in merge depicts the location of the three sheath nuclei in focus. (D) Expression of pGC433 in the head. Note neuron with anteriorly directed process encircling pharyngeal isthmus in upper animal (depicted in black in cartoon to right of images). (C) and (D): Left panel, DIC; middle panel, GFP fluorescence; right panel, merged image. Scale bar, 20 μm.

