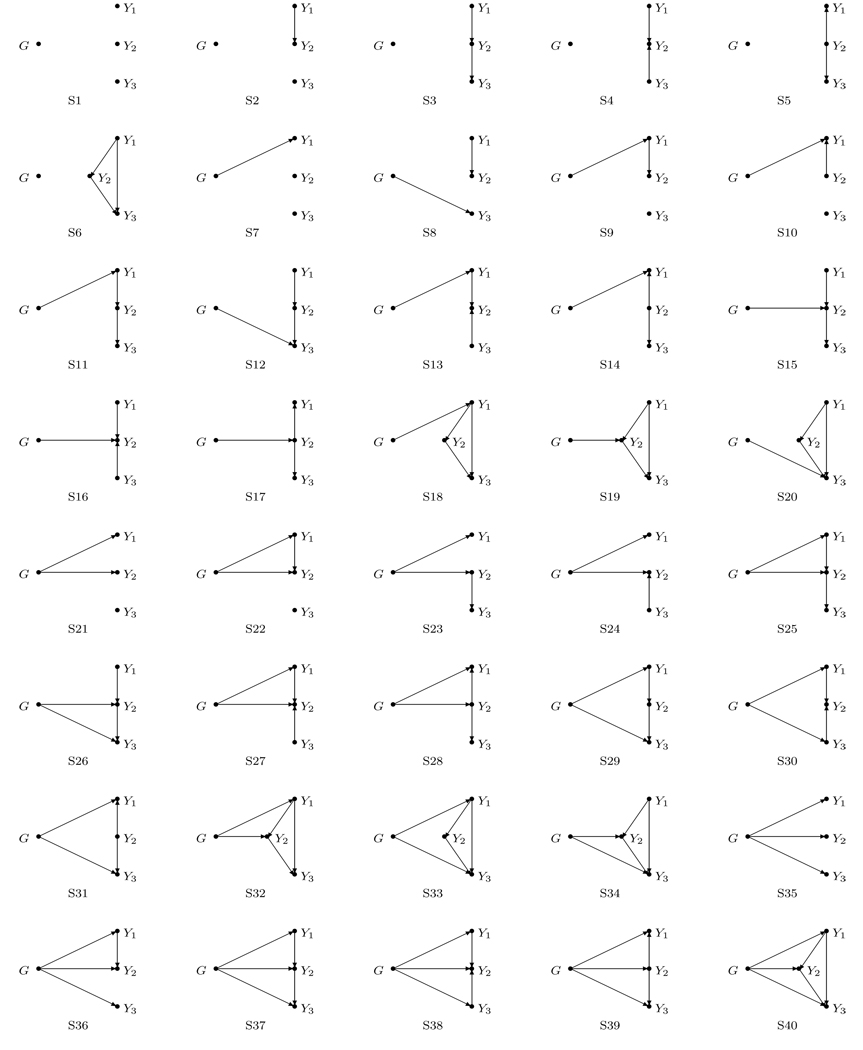
Figure 1.
Forty causal structures among one disease gene G and three traits Y1, Y2 and Y3 that are illustrated by DAGs. The arrows from G to Yj and from Yk to Yj represent that there exist direct effects of G on Yj and Yk on Yj for j, k = 1, 2, 3. The locations of Y1, Y2 and Y3 can be exchanged arbitrarily in each structure.

