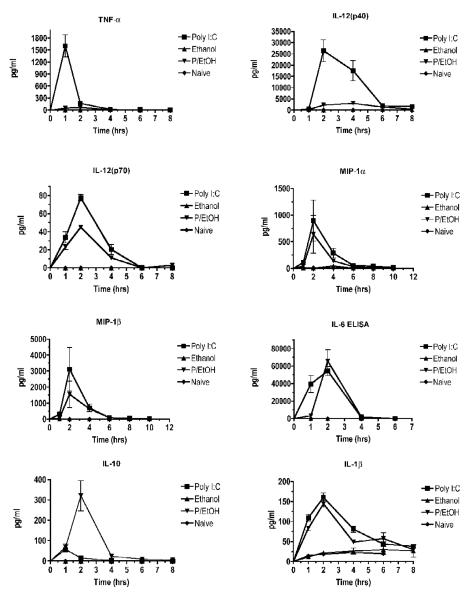
Figure 3. Cytokine time courses.
Serum collected from mice used in the experiment shown in Figure 1 was used to measure cytokine concentrations for different treatment groups at a range of times after stimulation with poly I:C. Cytokine concentrations (except for IL-6 and IFN-α) were measured using Bioplex multiplex assays. IL-6 and IFN-α were measured by ELISA. Values shown are means ± SEM (n = 5), and values that do not share any lowercase letters above the bar are significantly different (p < 0.05, by ANOVA and Newman-Keul’s post hoc test).

