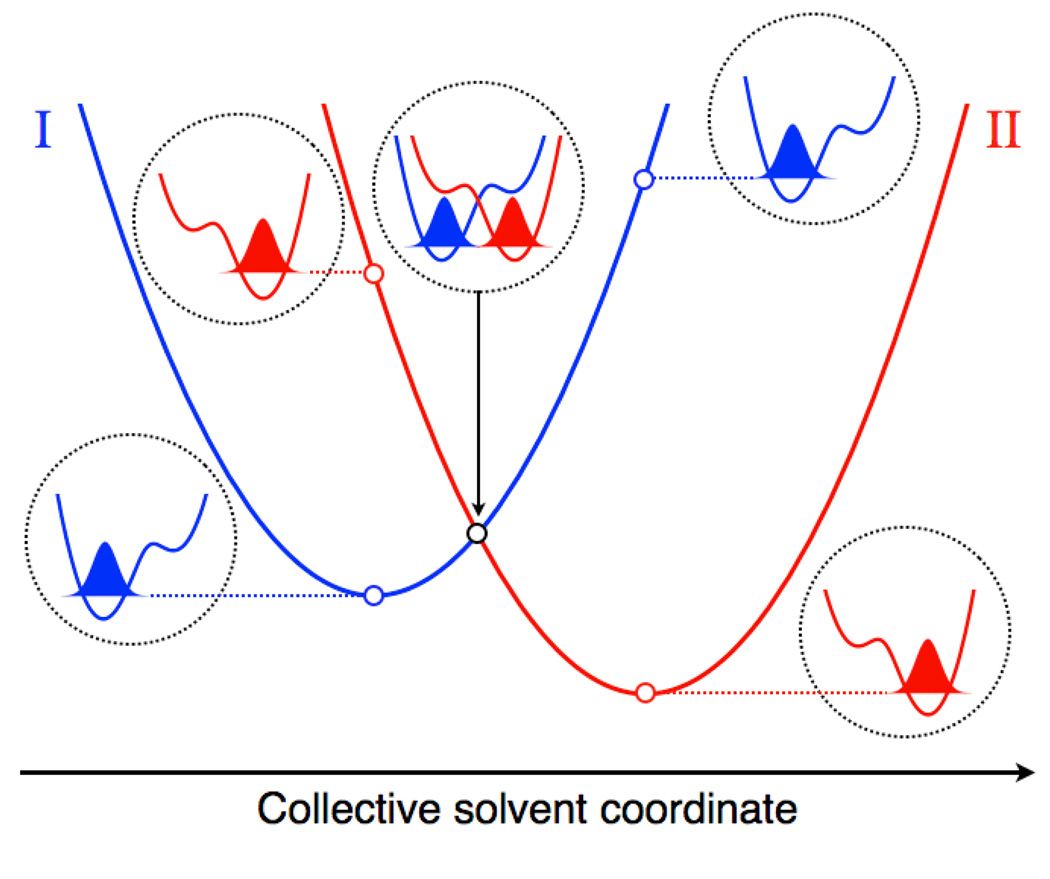
Figure 3.
Slices of the free energy surfaces for the ground reactant (I) and product (II) vibronic states along a collective solvent coordinate. The proton potential energy curves along the proton coordinate and the corresponding ground state proton vibrational wavefunctions are depicted for the reactant minimum, the crossing point, and the product minimum of the free energy curves. The energies of these proton vibrational states correspond to the open circles on the free energy curves. The proton potential energy curves associated with the crossing point are shifted higher in energy for clarity.

