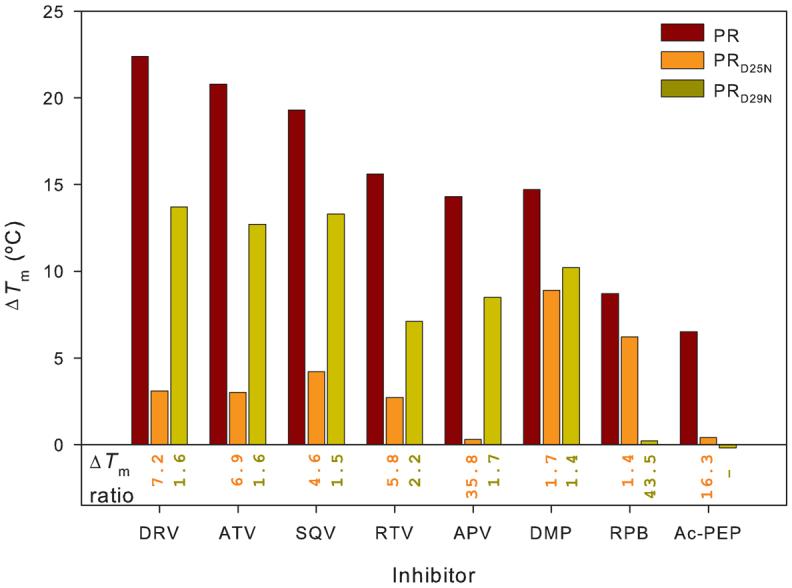
Fig. 2. Effect of PR inhibitors on ΔTm values for PR, PRD25N and PRD29N.

The bar graphs (ΔTm) represent the increase in Tm observed on binding of each of the inhibitors to each of the PR constructs (PR, red; PRD25N, orange; PRD29N, dark yellow). Numbers under the bar graphs are the ratios of ΔTm(PR)/ΔTm(PRD25N) (orange) and ΔTm(PR)/ΔTm(PRD29N) (dark yellow) for each of the inhibitors; large numbers for this ratio indicate that the mutated residue makes a large contribution to inhibitor binding. Data for PR and PRD25N in the absence of inhibitor and in the presence of a twofold molar excess of DRV or RPB are taken from ref. 17.
