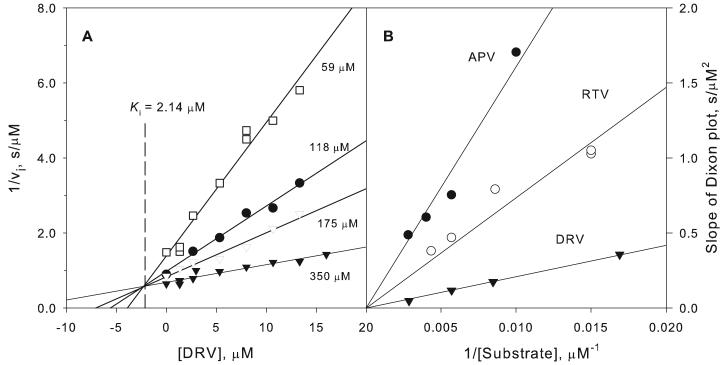
Fig. 3. Kinetic inhibition of pepsin by DRV, APV and RTV at pH 3.
For experimental details see text. A. Dixon plots showing the concentration dependence of inhibition by DRV at varying substrate concentrations. The lines intersect at −Ki as required for competitive inhibition. B. Replots of the slopes of the Dixon plots vs. 1/[substrate] for the data shown in A as well as for APV and RTV. The slopes of these secondary plots are equal to Km/VmaxKi for each inhibitor; thus, steeper slopes correspond to smaller values of Ki.

