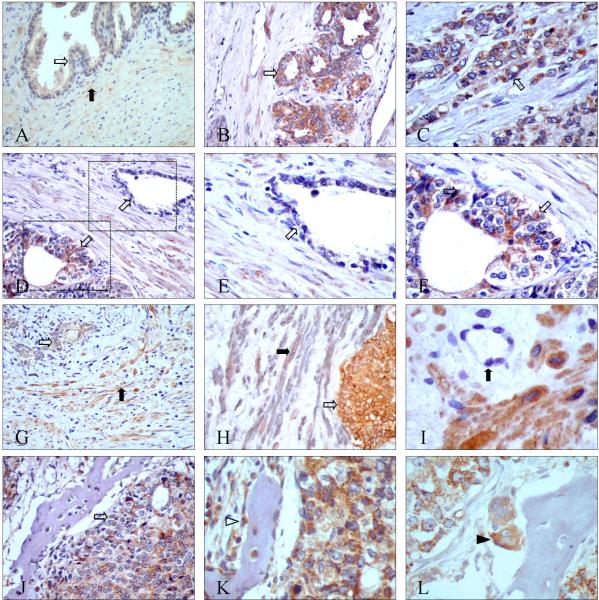
Figure 4. Representative immunohistochemical localization of PAR-2 in normal, primary prostate cancer, and bone metastasis.
A: Normal prostate tissues showed weak PAR-2 expression in epithelial cells (white arrow) and stromal cells (black arrow); B, C: PAR-2 expression in epithelial cancer cells (white arrows) in low Gleason pattern glands (B) and high Gleason pattern glands (C); D-F: PAR-2 was highly expressed in malignant glands (bottom-left corner of D, magnified in figure F) but not in benign glands (top-right corner of D, magnified in figure E); G: Besides cancer cells (white arrow), PAR-2 expression was also observed in some stromal cells (black arrow); H*: Double IHC of PAR-2 (in brown) and α-SMA(in gray): cancer cells were PAR-2 positive (white arrow), and some of the stromal cells co-expressed PAR-2 and α-SMA(black arrow); I: PAR-2 was not present in endothelial cells (black arrow); J: PAR-2 was highly expressed in cancer cells in bone metastasis (white arrow); K: PAR-2 was present in osteoblasts (white arrowhead); L: PAR-2 was present in osteoclasts (black arrowhead).
Original magnification: A, B, D, G, and J ×200; C, E, F, H, K, and L×400; I×600
*No counterstaining was performed in double-label IHC.

