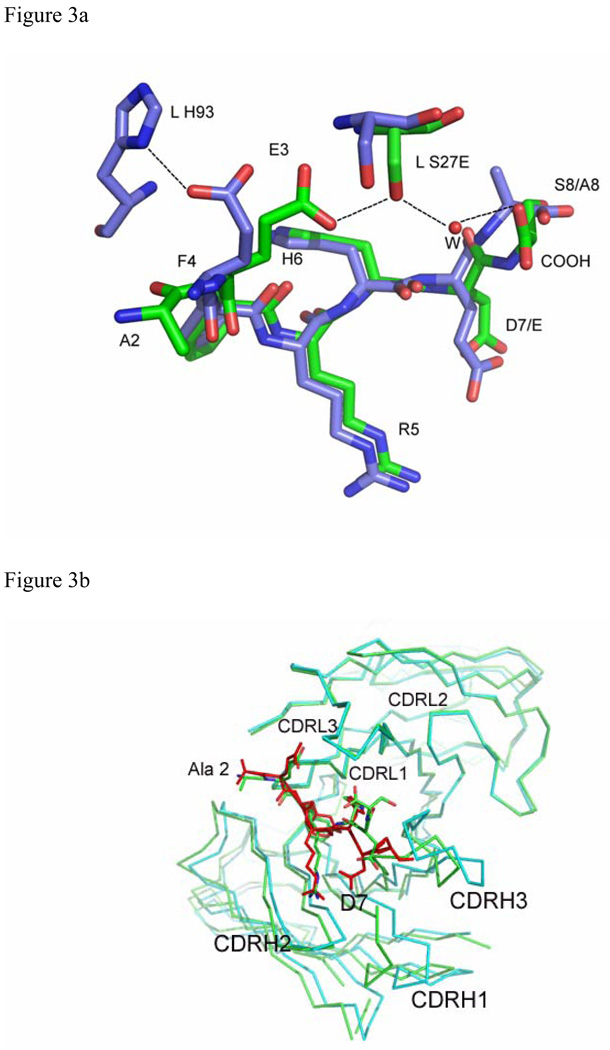
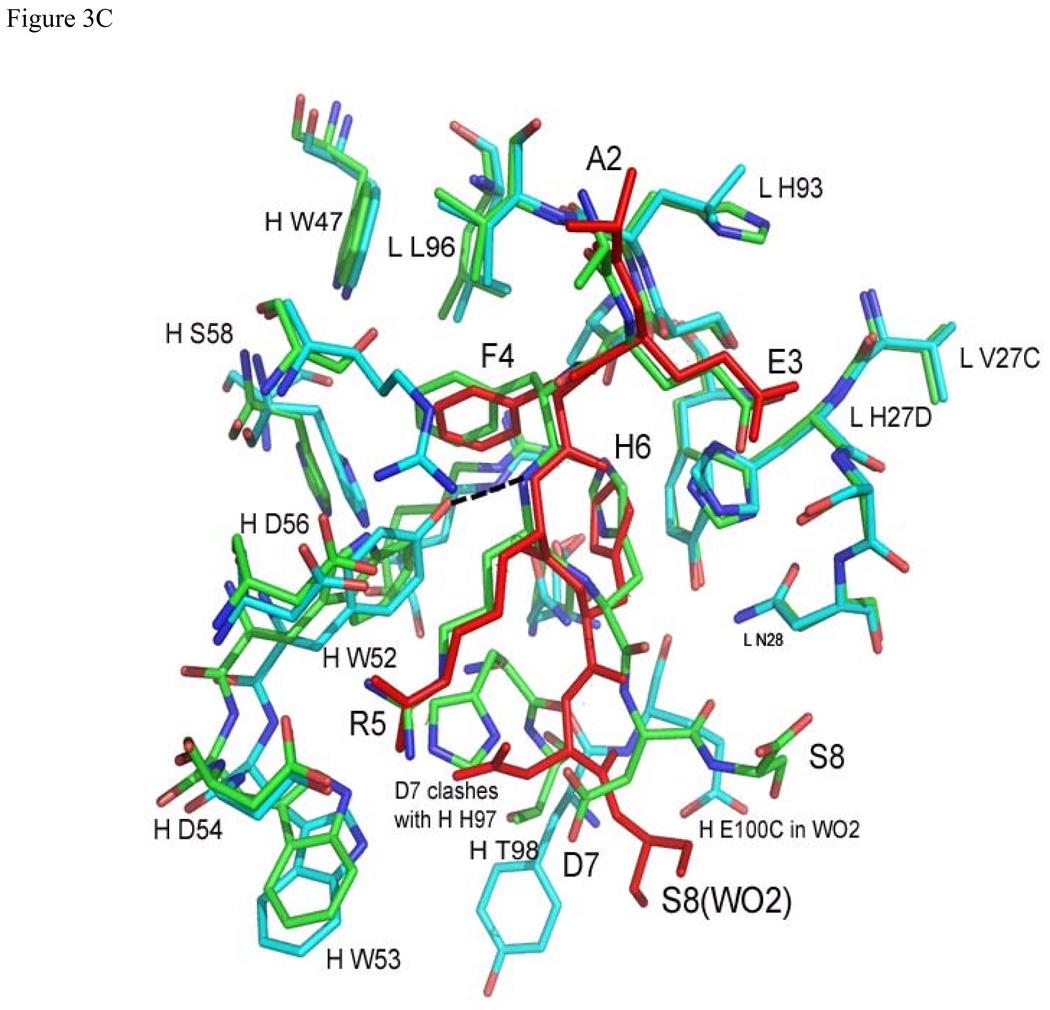
Figure 3.
Superposition of Aβ and related structures: (a) Aβ(1–8) (green) and Ror2(518–525) (purple) bound to PFA1 (PFA1 residues are drawn in the same colors corresponding to each peptide), (b) Superposition of PFA1 (CDRs and peptide drawn in green) and WO2 (CDRs cyan, and peptide drawn in red) CDRs and (c) Comparison of PFA1-Aβ(1–8) (peptide and Fab residues are in green) and WO2-Aβ(1–16) (peptide drawn in red and the Fab residues are in cyan) binding sites. One hydrogen bond is shown in dashed lines between HC Y52 of WO2 and the amide of R3 of the Aβ(1–16) to highlight the CDR sequence difference at HC Y52. The Fab residues are labeled according to the PFA1 sequence and numbered according to the Kabat convention (http://www.biochem.ucl.ac.uk/~martin/abs/GeneralInfo.html).


