
Figure 3.
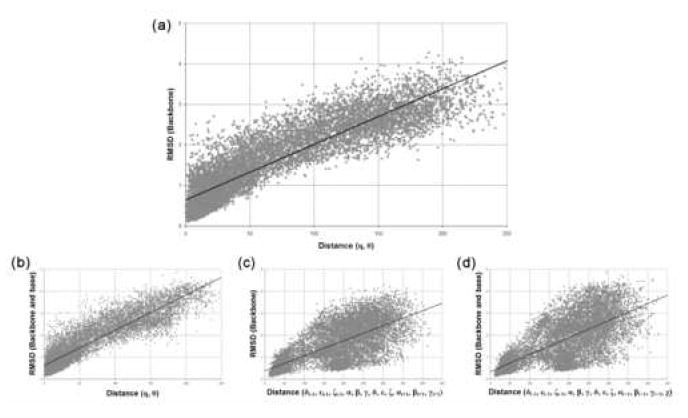
Scatter plots of RMSD versus distance in the η−θ plane or standard torsional angles for 10,000 random pairs of nucleotides from the data set. For each plot, the best fit line is shown on the plot. (a) RMSD of backbone atoms versus distance in the η-θ plane. The correlation coefficient is 0.80. (b) RMSD of backbone atoms versus distance of standard torsional backbone angles. The correlation coefficient is 0.50. (c) RMSD of backbone, sugar, and base atoms versus distance in the η-θ plane. The correlation coefficient is 0.81. (d) RMSD of backbone, sugar, and base atoms versus distance of the standard torsional angles (including χ). The correlation coefficient is 0.50.