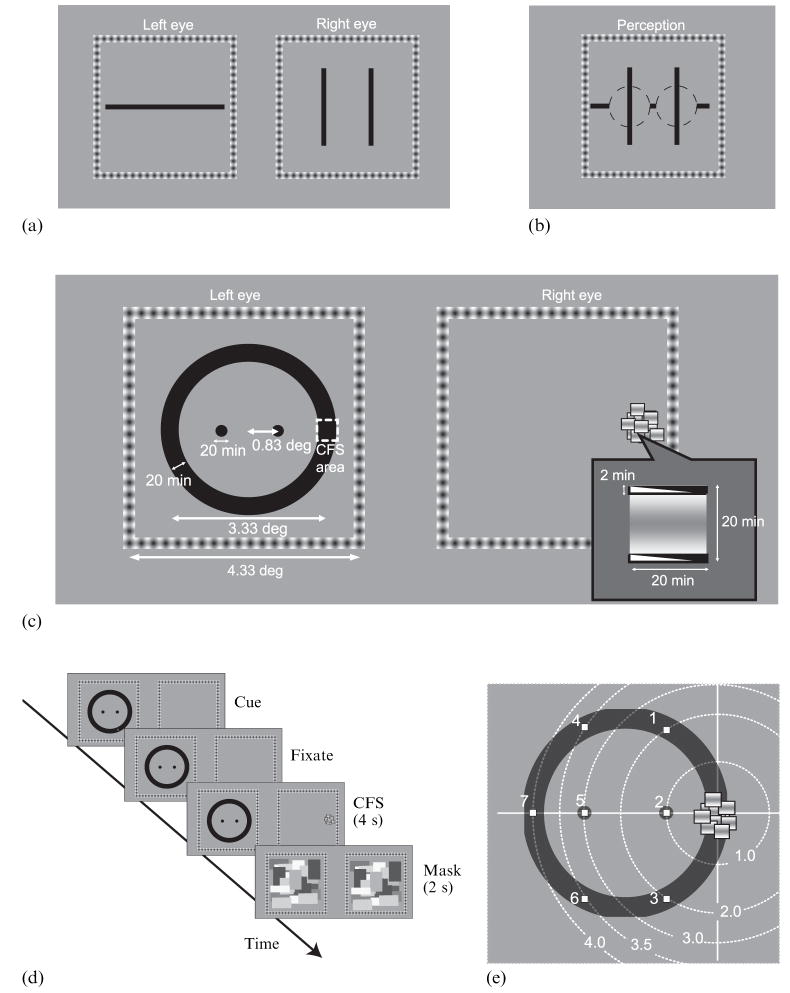
Figure 1.
Conceptual bases of the main experiment. (a) Schematic of stimuli used by Kaufman (1963) to measure the spatial spread of binocular rivalry suppression. (b) Schematic of characteristic perceptual experience by observers in Kaufman’s experiment. (c) Schematic figure of stimuli used in the main experiment. Note that the wedge in the CFS (continuous flash suppression) component above and below the sinusoidal grating represents the dynamic contrast reversal of these bars that flanked the grating. In the actual CFS stimuli, a uniform black bar was rapidly interchanged with a uniform white bar. (d) Diagram of the procedure in the main experiment. (e) Seven possible positions of the ‘indicator’ mark (indicating the position that observers were to monitor on that particular trial; see methods for the main experiment) and the distances of that mark from the centre of CFS stimulus. Distances are here normalized by the distance between the CFS center and the nearby interior disk (0.83 deg).

