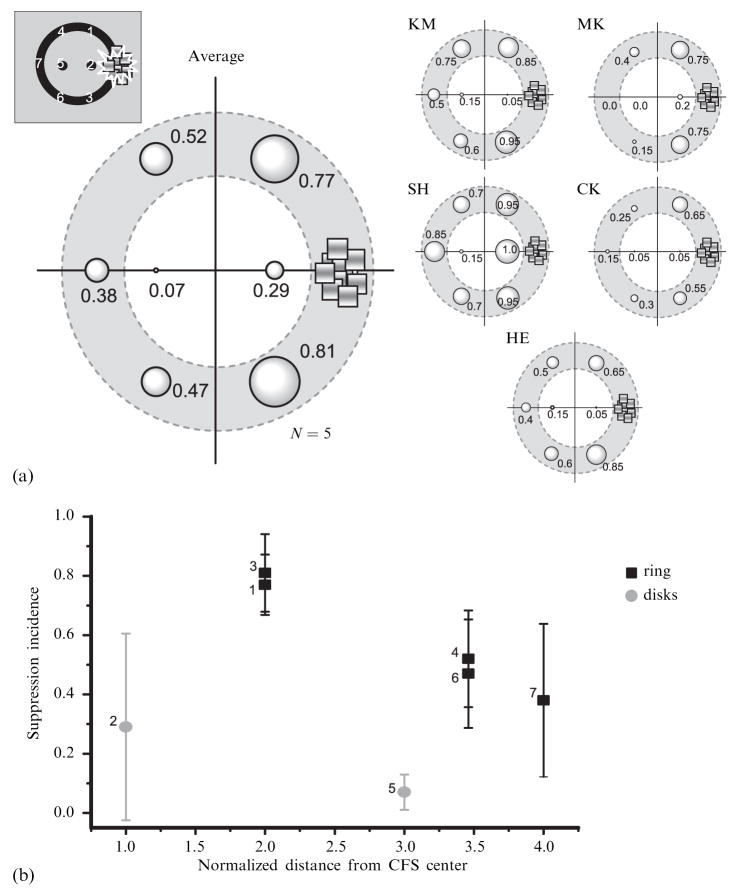
Figure 2.
Results of the main experiment. (a) The incidence of suppression at each position is expressed by the size of the bubble at that location. (b) The mean suppression incidence as a function of the distance from the center of the CFS (continuous flash suppression) area. The distance is normalized by the distance between the CFS center and the nearby interior disk (0.83 deg). Data for black rectangles show incidence of suppression at the positions on the outer ring. Data for gray circles show incidence of suppression on the interior disks. Prefix numbers near symbols indicate the positions indicated in figure 1e. Error bars show 95%-confidence intervals.

