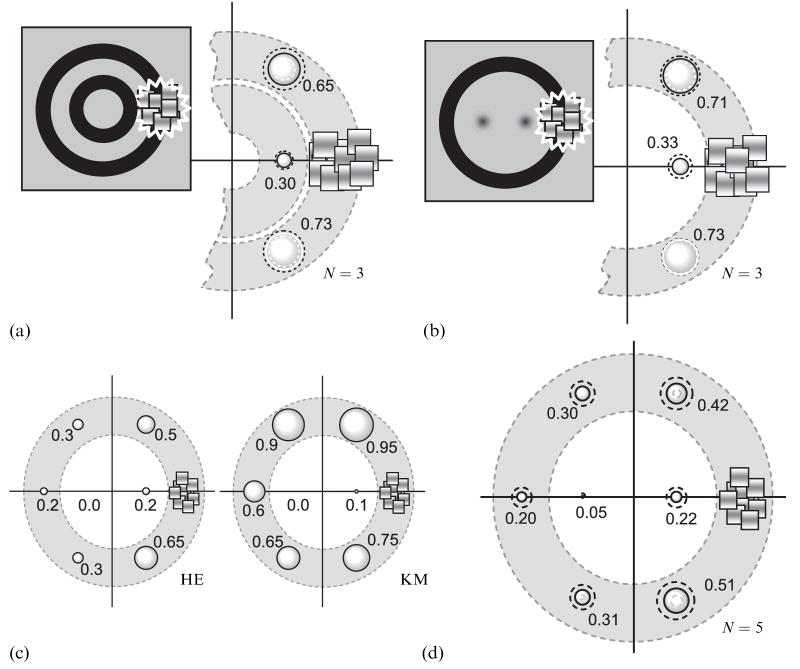
Figure 3.
Results of control experiments. (a) and (b) The results of measurements with the central disks replaced by one of two stimuli: a small diameter ring (a) or blurred disks (b). Data are shown as in figure 2a. The dotted gray and black circles show the 95%-confidence intervals. (c) The results of measurements with large fuse frames. Data are shown as in figure 2a. The dotted gray and black circles show the 95%-confidence intervals. (d) Results from experiment in which suppression was induced by a static Mondrian pattern. Data are shown as in figure 2a. The dotted gray and black circles show the 95%-confidence intervals.

