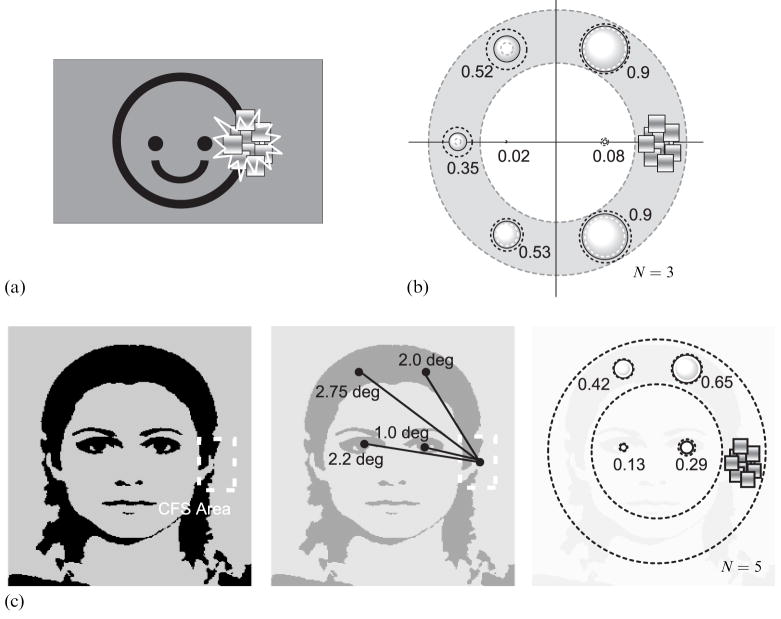
Figure 4.
Spread of suppression with an iconic face and with a digitized face image. (a) and (b) Stimuli and results for the ‘iconic face’ experiment. Data are shown as in figure 2a. The dotted gray and black circles show the 95%-confidence intervals. (c) Stimuli and results for the ‘digitized face’ experiment. Left panel shows the digitized face image used as the target stimulus. Center panel schematizes distances between the CFS (continuous flash suppression) center and four monitored positions. Right panel shows mean suppression incidences. Data are shown as in figure 2a.

