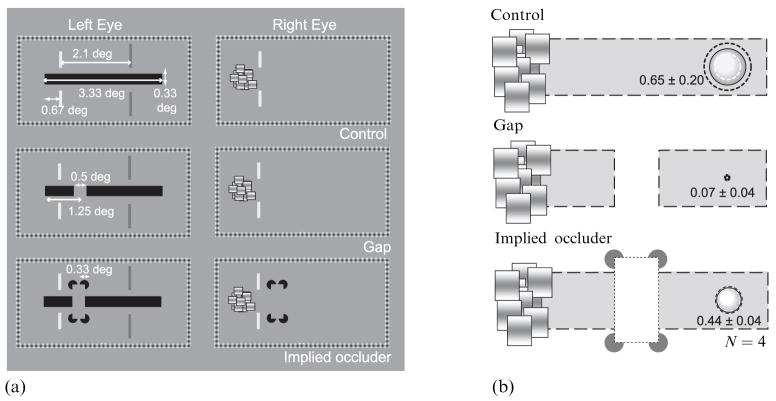
Figure 5.
Stimuli and results in the ‘gap’ experiment. (a) Stimuli in the ‘gap’ experiment. Top panel shows a schematic of stimuli in the ‘control’ condition. Middle panel shows a target configuration in the ‘gap’ condition. Bottom panel shows a target configuration in the ‘implied occlusion’ condition. In all conditions, observers fixated on the part of target horizontal bar indicated by a pair of red vertical line segments (shown here in light gray) and monitored the part of target bar indicated by a pair of green vertical line segments (shown here in dark gray). The monitored position was located 2.1 deg right of the fixation position. (b) Results from four observers. Mean incidence of suppression for each condition is expressed by the size of the bubble. The dotted gray and black circles show the 95%-confidence intervals.

