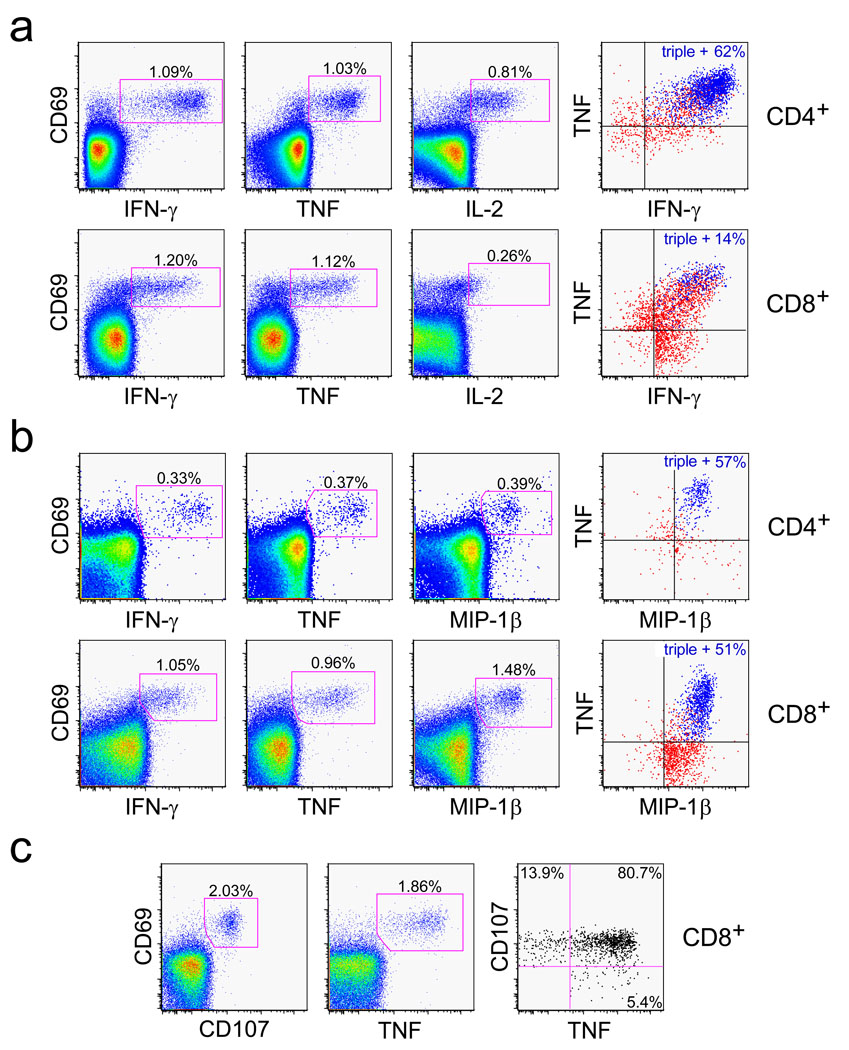
Figure 3. RhCMV-vectored SIV-specific T cell responses maintain potent effector function.
Representative FCICA of peripheral blood CD4+ and/or CD8+ T cells responding to SIV Gag or Rev/Nef/Tat overlapping peptides from RM that were inoculated with the corresponding RhCMV vector greater than 500 days earlier. The figures show coordinate analysis of a, TNF vs. IFN-γ vs. IL-2; b, TNF vs. IFN-γ vs. MIP-1β, and c, TNF vs. CD107 externalization (indicating degranulation of cytoplasmic cytotoxic granules). The left and middle profiles are gated on the overall CD4+ or CD8+ T cell populations with the percentage of the designated responding populations (CD69+, cytokine+ or CD107+) shown in each profile. The right profiles are Boolean gated on total responding T cells (those making any of the designated cytokines or expressing CD107, alone or in combination), with either the percentage of triple producers (a and b, colored blue), or the percentage of responding cells showing CD107 and TNF reactivity alone or in combination (c) designated in the figure [see also Supplementary Figs. S4 and S5].

