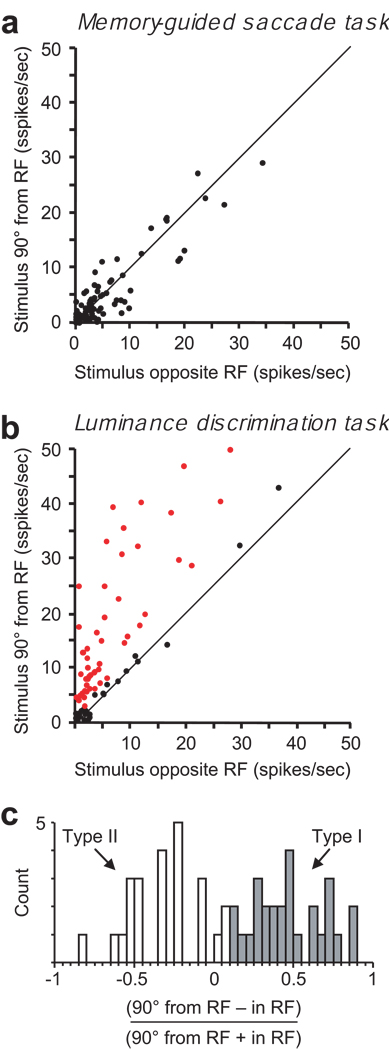
Figure 3.
Population analysis of anticipatory activity. (a) A comparison of activity in the memory-guided saccade task in the last 200 ms of the delay period on trials in which the target is flashed at different locations outside the receptive field – ‘Opposite the RF’ and ‘90° from RF’. The diagonal represents equal activation. None of the 85 neurons exhibited significantly different activity during the delay period for the two conditions (p > 0.05). (b) Corresponding comparison of delay period activity in the luminance discrimination task in which the green cue appears at different locations outside the receptive field. The red dots represent neurons in which the activity during last 200 ms of the delay period was significantly greater (p < 0.05) on ‘90° from RF’ trials than on ‘opposite the RF’ trials. Sixty percent (51/85) of the neurons exhibited significant anticipatory activity preceding the appearance of a luminance stimulus in their RF. (c) Differentiation of type I and type II neurons. The histogram shows the distribution of the contrast ratios of the 51 neurons identified in (b) comparing the anticipatory activity (90° from RF trials) to the activity when the green cue stimulus was in the RF (in RF trials) during the last 200 ms of the delay period. Type I neurons (gray bars) were defined as those in which the anticipatory activity preceding the appearance of the luminance stimuli was significantly greater than the activity related to the visible green cue stimulus (see Fig. 2). The remaining neurons with anticipatory activity (white bars) were defined as type II (see. Fig. 4).

