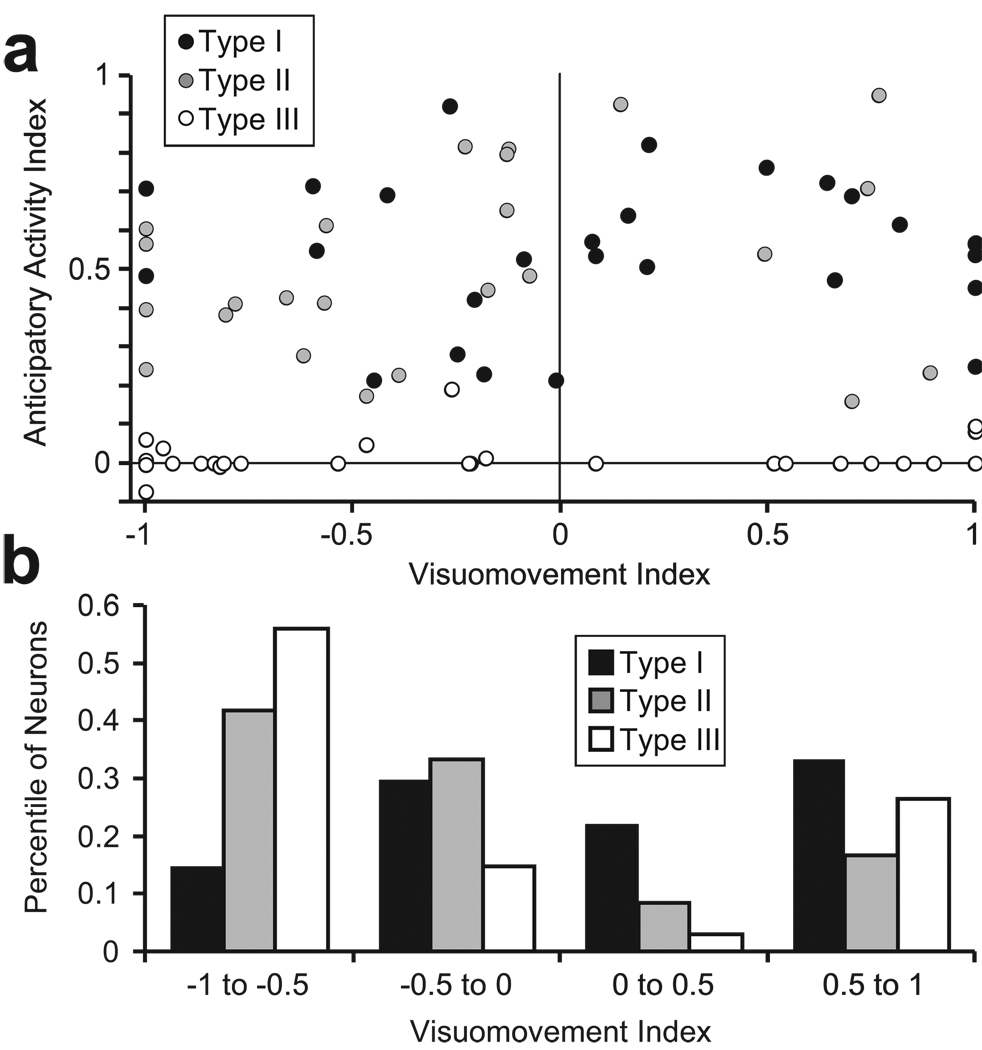
Figure 6.
Relationship between anticipatory activity in the luminance discrimination task and FEF neuron classification along a visuomovement continuum. (a) The anticipatory activity index is plotted as a function of visuomovement index for type I neurons (black circles), type II neurons (gray circles) and type III neurons (white circles). The anticipatory activity index is a contrast ratio that quantifies the magnitude of anticipatory activity in the last 200 ms of the delay period recorded during the luminance discrimination task; (R90°-Ropp)/ (R90°+Ropp), where R90° is the response on ‘90° from RF’ trials and Ropp is the response on ‘opposite RF’ trials. Values near 0 indicate no anticipatory activity and values near +1 indicate strong anticipatory activity. The visuomovement index is a contrast ratio of the visual and saccade-related responses recorded during the memory-guided saccade task. Neurons with values near −1 are dominated by a visual response, and neurons near +1 are dominated by saccade-related activity. Values near 0 indicate nearly equivalent visual and saccade related activity. (b) Distribution of proportions of type I (black bars), type II (gray bars), and type III (white bars) neurons along the visuomovement continuum.

