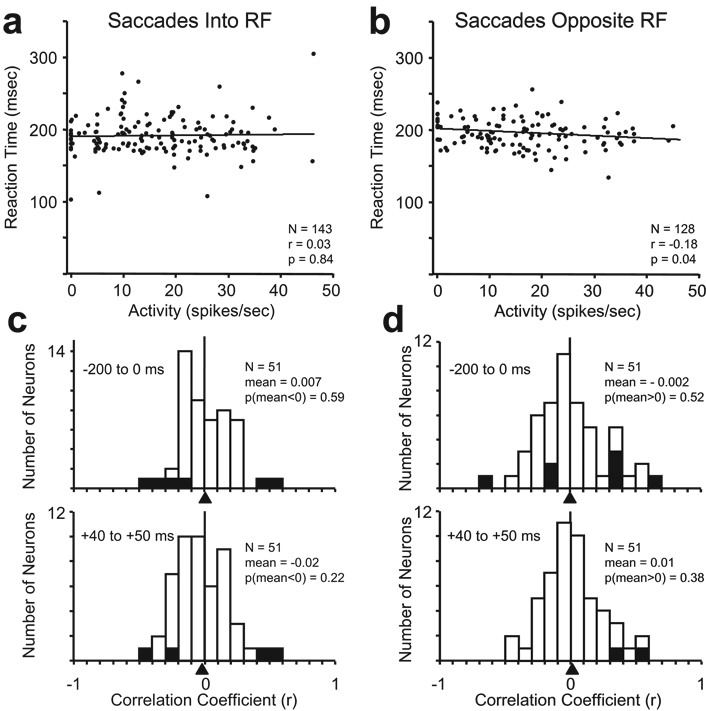
Figure 7.
Correlation analysis of saccadic reaction time versus delay period activity in the luminance discrimination task. Saccadic reaction times plotted as a function of anticipatory activity from the neuron shown in Figure 2 for (a) saccades into the RF, and (b) saccades opposite the RF. Activity was averaged over last 200 ms of the delay period. Each data point represents a single trial. The best fit regression lines are shown. The Pearson correlation coefficient (r), number of trials (N), and probability of significant correlation (p) are shown in the plots for each set of trials. The distributions of correlation coefficients of activity versus reaction time are shown obtained from all 51 anticipatory neurons for (c) saccades into the RF, and (d) saccades opposite the RF for the average activity during the last 200 ms before the appearance of the luminance stimuli (upper histogram), and for the average activity between 40 and 50 ms following the appearance of the luminance stimuli (lower histogram). Triangles below the abscissas indicate the mean correlation coefficients for each condition. The number of neurons (N), the mean correlation coefficient (mean), and the statistical probability (one-tailed z-tests) that the mean is less than 0 for saccades into the RF (c) and greater than 0 for saccades opposite the RF (d) are shown in each histogram. Hatched bars represent individual neurons with statistically significant correlations (p<0.05).

