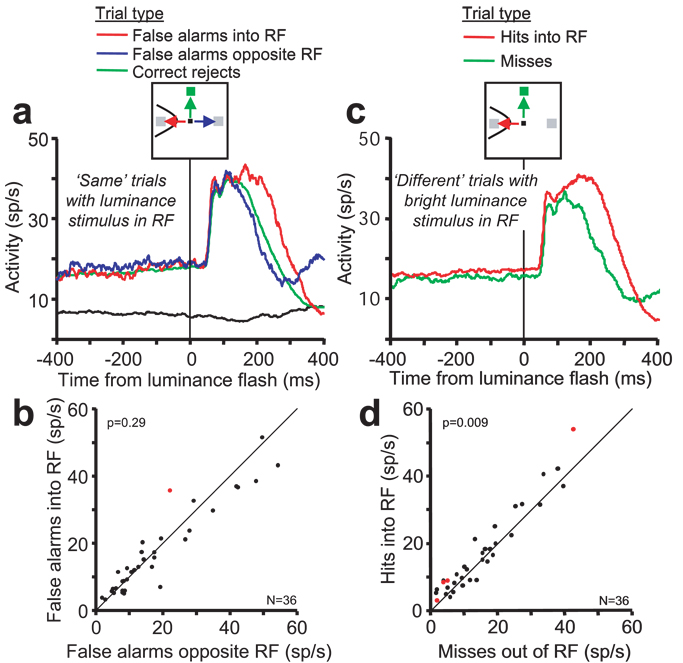
Figure 8.
Comparisons of activity across trial conditions in which a luminance stimulus appeared in the neurons’ RF. (a) Pooled average activity of 36 type I and type II neurons on ‘same’ trials in which the luminance stimuli appear in the RF. Activity is aligned on the time of the onset of the luminance stimuli. The different trial conditions and the saccade directions are indicated by the arrows and line colors in the cartoon at the top. The red and blue traces show the average activity on false alarm trials in which the saccade was made incorrectly to the luminance stimulus located in the RF and opposite the RF, respectively. The green activity trace shows the average activity on trials in which the saccade was correctly made to the green cue stimulus located 90° from the RF (correct rejects). For comparison, the black line shows the activity on ‘Opposite RF’ trials in which both luminance stimuli were flashed outside the RF. (b) A comparison of the activity for type I and II neurons during the last 200 ms of the delay period on false alarm trials ending with an incorrect saccade into the RF and opposite the RF (represented by the red and blue activity traces). Only one neuron exhibited a significant activity difference (red data point, p < 0.05). The responses of the remaining 35 neurons were distributed along the diagonal representing equal activation for saccades into the RF and opposite the RF. The probability that the entire sample of neurons exhibited equal activity based on a paired t-test is shown at the top left corner. (c,d) Pooled average activity and comparison of 36 type I and type II neurons on correct and error ‘different’ trials in which the bright luminance stimulus appeared in the RF. Conventions are the same as in (a,b). Four neurons exhibited a significant activity difference and, overall, the activity during the last 200 ms of the delay period was greater on hits than on misses.

