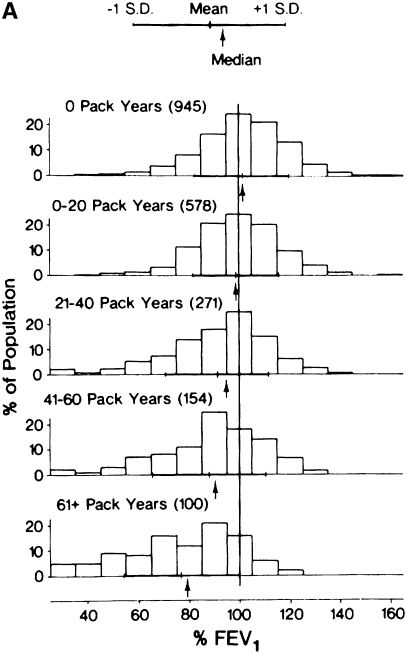
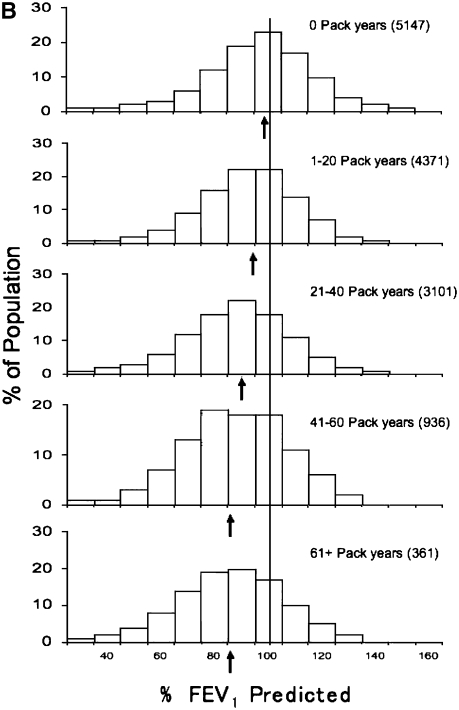
Figure 2.
Distribution of FEV1 values in relationship to smoking history. Note that there is a reduction in FEV1 with increasing smoking history. For each smoking history, however, there is considerable heterogeneity in FEV1 response. Even among nonsmokers, there is a subset with severe lung function impairment. Note the striking similarity of the data presented by (A) Burrows (11) and that of the (B) Copenhagen City Study several decades later (10) Reprinted by permission from Reference 10. The time course for the progression of individuals with varying smoking histories is unknown and likely follows many “natural histories.”


