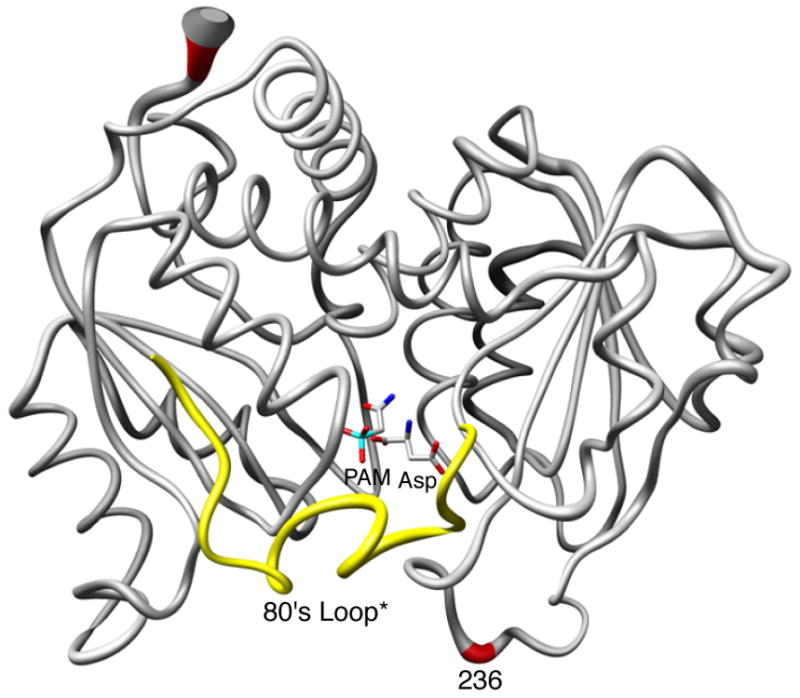
Figure 1.

Comparison of one catalytic chain (grey, red) of the R236_PA and RPALA structures along with the 80's loop of the adjacent catalytic chain (yellow, 80's loop*) The width of the tube is proportional to the RMS deviation between the α-carbon positions of the two structures. PAM and Asp are shown. This figure was drawn using Chimera.40
