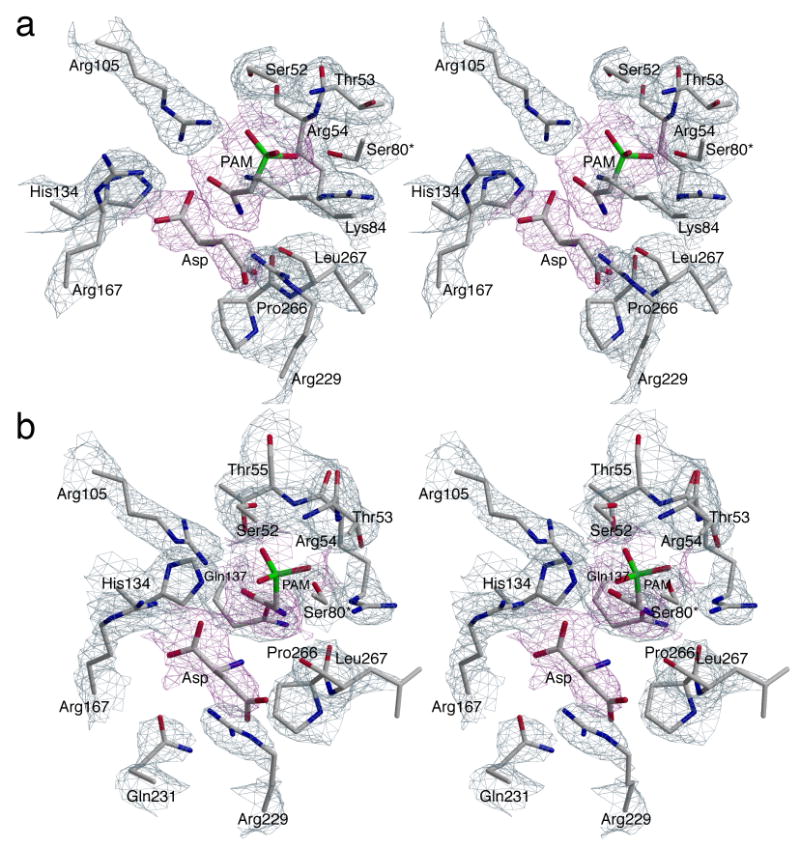
Figure 2.

Stereoview of the active sites in ATCase complexed with PAM and Asp: (a) chain C1 and (b) chain C6. The refined coordinates of the side chains are overlaid on the 2Fo−Fc electron density map (grey) shown contoured at 1.5σ. PAM and Asp are overlaid on the Fo−Fc electron density map (magenta) shown contoured at 1.0σ.
