
Figure 4.
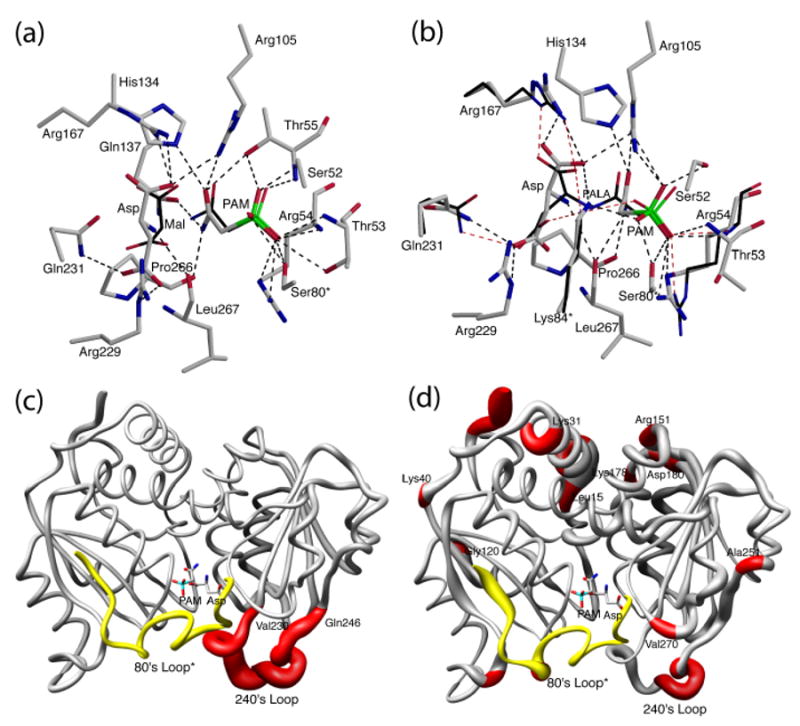
The positions of PAM and Asp (elemental color) in the active site of R236_PA structure compared to (a) the positions of PAM and malonate (thin, black) in the RPM structure and (b) the positions of PALA in the RPALA structure (thin, black, only the residues that are in different positions are shown). The two structures were first superimposed using SEQUOIA.41 The comparison of one catalytic chain (grey, red) of ATCase along with the 80's loop of the adjacent catalytic chain (yellow, 80's loop*) of the R236_PA structure (c) with the TCP structure, and (d) with the R236_P structure. The width of the tube is proportional to the RMS deviation between the α-carbon positions of the two structures. PAM and Asp are shown to indicate the active site position.