
Figure 8. Tolerance to mutation in the p110α affinity pocket.
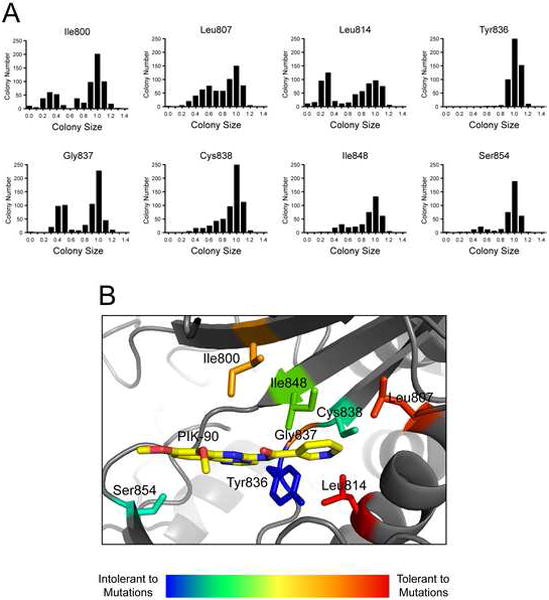
A: Colony size distributions for 384 colony arrays of the indicated p110α mutant libraries, grown in the YRP1 strain on SD −URA +Galactose media as described in Fig. 4A.
B: Tolerance to mutation as calculated by Σ(1-x)2 from the distributions in Fig. 8A, where x equals relative colony size. These values were converted into heat map values and are shown on the p110α crystal structure (PDB code 2RD0) with the PI3K inhibitor PIK-90 from the p110γ co-crystal structure (PDB code 2CHX) overlaid by structural alignment.