
Figure 1.
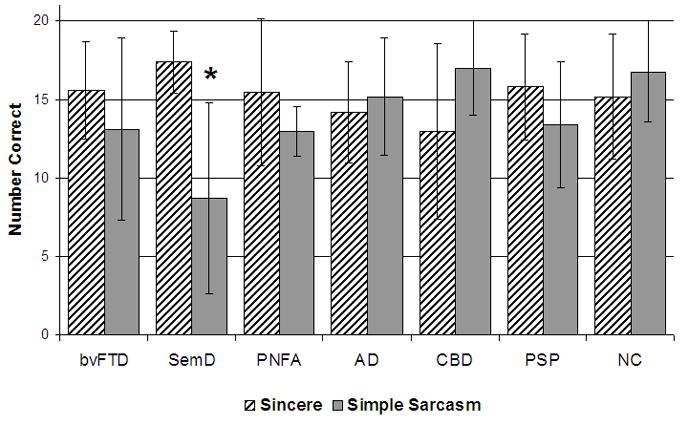
Bar graph representing the performance of each diagnostic group on both the Sincere (SIN) condition and the Simple Sarcasm (SSR) condition of the TASIT. No group differed significantly from healthy older control subjects on SIN, but the Semantic Dementia group performed significantly worse on SSR. Error bars represent ±1 SD from the mean.