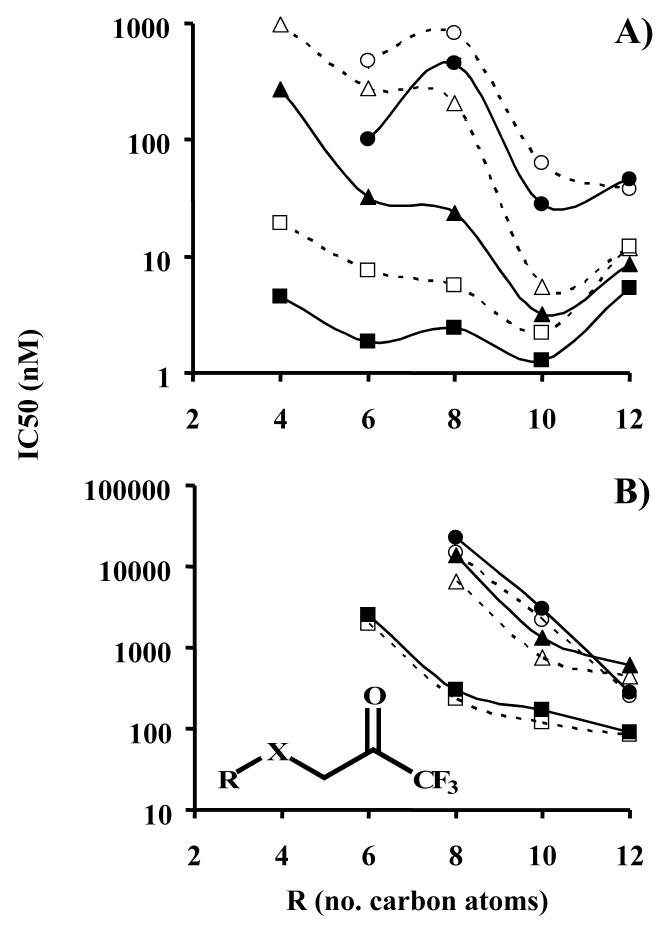
Figure 3.
Effect of alkyl chain length and sulfur oxidation state upon inhibitor potency for A) porcine esterase and B) fatty acid amide hydrolase, FAAH. IC50 values were measured following either 5 or 15 min incubation of enzyme and inhibitor. Results are shown as the average ± standard deviation of 3 replicates (error bars are not viewable due to the logarithmic scale, average RSD = 5.4% for esterase and 8% for FAAH). Linear regression values (r2) for the FAAH curves for R = 6, 8, 10 and 12 carbons were: 5 min 0.94, 0.64, 0.46 and 0.41, respectively; 15 min 0.72, 0.45, 0.47 and 0.48, respectively. If an exponential fit was used, the 15 min values were: 0.99, 0.82, 0.69 and 0.62, respectively. The general inhibitor scaffolding is shown in the insert of graph B, with X being thioether, sulfoxide or sulfone as shown in Figure 1. The graph symbols are:  Sulfone 5 min,
  Sulfone 15 min,
  Sulfoxide 5 min,
  Sulfoxide 15 min,
  Thioether 5 min,
  Thioether 15 min

