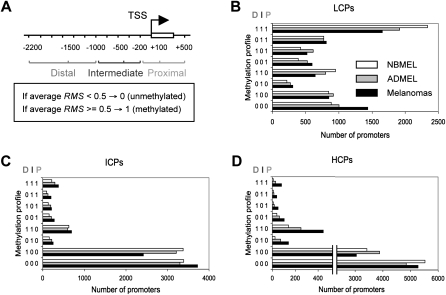
Figure 1.
Distribution of promoter methylation in normal melanocytes and melanoma cells. (A) Diagram showing the three promoter regions relative to the TSS: Proximal (−200 to +500 bp), Intermediate (−200 to −1000 bp), and Distal (−1000 to −2200 bp). Each region is labeled as highly methylated (1) or unmethylated (0) if its average probe-level RMS is higher or lower than 0.5, respectively. (B) Number of LCPs for each cell type (NBMEL, ADMEL, and melanomas) and for each methylation profile. (e.g., 111 fully methylated, 001 proximally methylated, and combination thereof). (C,D) The same as B, for ICPs and HCPs.

