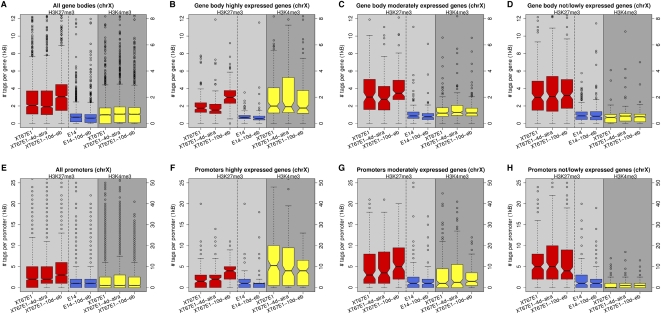
Figure 7.
Boxplots of the occupancies of H3K27me3 and H3K4me3 over promoters and gene bodies of chromosome X. Genes were binned in three equally sized groups of 212 genes according to expression level, representing not/lowly-, moderately-, and highly-expressed genes, respectively. The red boxplots represent H3K27me3 occupancies for the female XT67E1 cells, while the yellow boxplots represent H3K4me3 occupancies. The blue boxplots represent H3K27me3 occupancies for the male E14 cells. (A–D) Distribution of H3K27me3 and H3K4me3 over gene bodies (from +500 to the end of Ensemble genes). (E–H) Distributions of H3K27me3 and H3K4me3 over gene promoters (from −700 to +300 of Ensemble genes).

