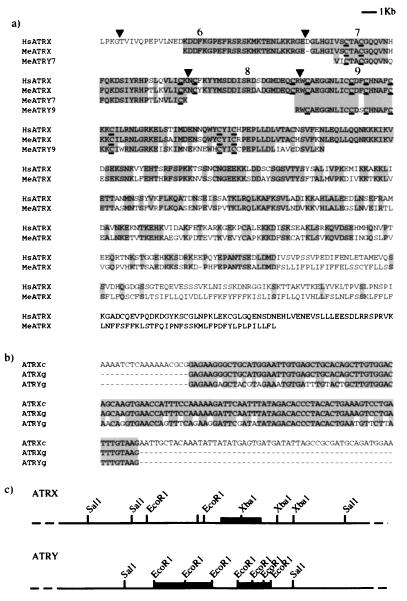
Figure 2.
ATRX/Y sequence analysis. (a) Amino acid alignment of human ATRX cDNA sequence (39) with tammar wallaby ATRX cDNA clone (MeATRX) and ATRY genomic sequence of exons 7 (MeATRY7) and 9 (MeATRY9). Shaded regions denote identity. Solid arrows indicate the position of introns in the human gene, and numbers indicate exon number. Underlined amino acids indicate cysteines located in potential zinc fingers (39). (b) Sequence alignment of ATRX cDNA clone (ATRXc) with ATRX genomic sequence (ATRXg) and ATRY genomic sequence (ATRYg). Shaded regions denote identity. (c) Restriction enzyme maps of the ATRX and ATRY genomic clones. Black boxes indicate regions of homology to the human ATRX probe.

