Figure 1.
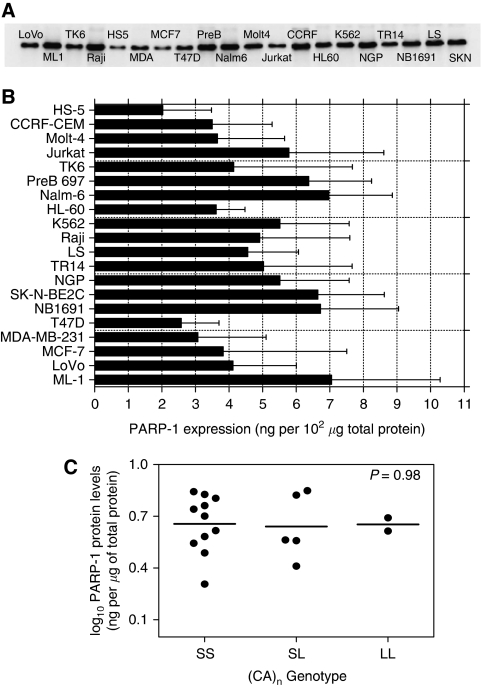
PARP-1 expression in the cell line panel. (A) Upregulation of PARP-1 expression in tumour cell lines detected by western blot analysis. (B) Semiquantitative analysis of the results of replicate experiments of the kind shown in A: Columns, mean of samples analysed in triplicate in three separate experiments; bars, s.d.; line, mean of all samples. (C) PARP-1 protein levels (expressed as log10) in relation to (CA)n microsatellite polymorphisms; SS – short alleles (CA)11–12/(CA)11–12, SL – short/long alleles (CA)11–12/(CA)13–20, LL – long/long alleles (CA)13–20/(CA)13–20. P-value calculated by Student's t-test (SS vs SL).

