Figure 1.
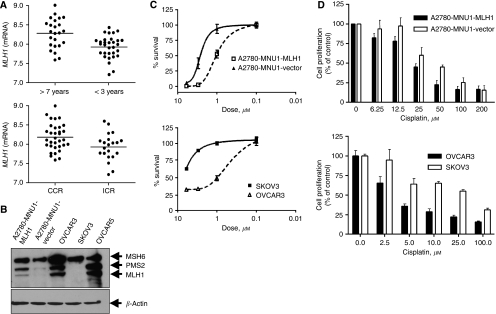
MLH1 expression and chemotherapy sensitivity in ovarian cancer cells and patients. (A) Correlation of MLH1 mRNA expression in microarray analysis using log-transformed Robust Multiarray Analysis values (y axis) from 54 stage III or IV ovarian cancer patients with clinical response (top graph) and survival (bottom graph) as described in the text. CCR refers to complete clinical response and ICR refers to incomplete clinical response. (B) The cellular abundance of MLH1, MSH6 and PMS2 was determined by immunoblot analysis of whole-cell lysates prepared from MLH1-deficient (SKVO3 and A2780MNU1 vector, a cisplatin-resistant variant of the A2780 ovarian carcinoma cell line) and hMLH1-proficient (OVCAR3, OVCAR5 and A2780MNU1-MLH1) cells. The membranes were stripped and reprobed with β-actin antibody to ensure an equal protein loading. Arrows indicate 84 kDa MLH1, 96 kDa PMS2, 160 kDa MSH6 and 35 kDa β-actin bands. (C) 6-thioguanine clonogenic assay. Top graph. A2780-MNU1-MLH1 compared with the MLH1-defective A2780-MNU1vector. Bottom graph. OVCAR3, which has wild-type MLH1 compared with MLH1-defective SKOV3 cells. Cells were treated with varying amounts of 6-TG for 24 h and exposed to a drug-free medium for 8 days. Cell viability in C and D was determined by clonogenicity analysis. Values are mean±s.e.m. (n=3). (D) Cisplatin MTT proliferation assay. Cells as indicated in top and bottom graphs were treated with different concentrations of cisplatin for 24 h, with proliferation determined by MTT assay. Bars represent mean±s.e.m. (n=3, each experiment in triplicate).

