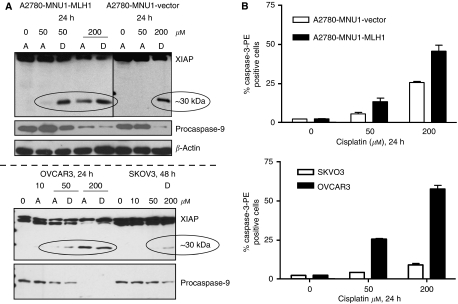
Figure 2.
Analysis of XIAP expression in lysates from cisplatin-treated ovarian cells. (A) Immunoblot analysis of XIAP (55 kDa intact and 30 kDa proteolytic fragment) and procaspase-9 indicated. Top panel: comparison of MLH1-proficient A2780MNU1-MLH1 and MLH1-deficient A2780MNU1 vector; bottom panel: comparison of OVCAR3 (MLH1 positive) and SKVO3 (MLH1 deficient) ovarian cancer cells. A indicates adherent and D indicates detached in the immunoblots. (B) Graphical representation of relative cell numbers expressing active caspase-3 analysed by flow cytometric analysis using anti-caspase-3-PE antibody in the indicated cell lines treated with cisplatin at 24 h.

