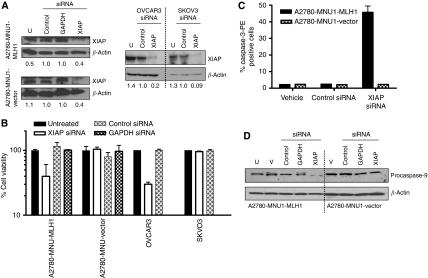
Figure 6.
Effect of XIAP siRNA in ovarian cancer cells. Cells were treated with indicated siRNA for 48 h. (A) Immunoblot analysis of the XIAP protein (55 kDa) expression in untreated, XIAP siRNA- and control siRNA-treated cell lysates. (B) Cell viability was monitored by Trypan blue exclusion assay (n=3 with quadruplicates in each n) and expressed as percentage untreated. The x axis shows various siRNA treatment and none indicates transfection reagent alone. (C) Graphical representation of relative cell numbers expressing active caspase-3 analysed by flow cytometric analysis using anti-caspase-3-PE antibody. (D) Immunoblot analysis of procaspase-9 expression.

