Figure 1.
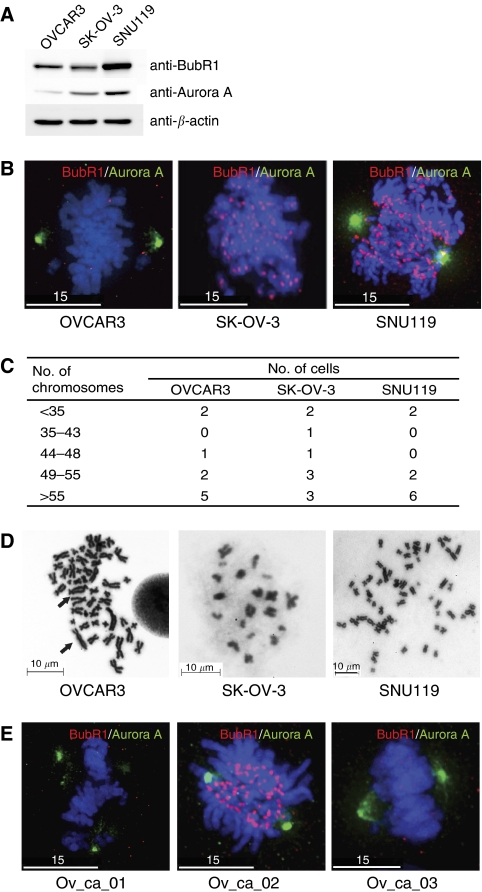
Assessing BubR1 and Aurora A levels and localisation in ovarian cancer cells. (A) Western blot analysis of ovarian cancer cell lines, OVCAR3, SK-OV-3, and SNU119, using anti-BubR1 and Aurora A antibodies. (B) Immunofluorescence analysis of ovarian cancer cell lines (OVCAR3, SK-OV-3, and SNU119). Cells grown on cover slips were fixed and immunostained with anti-BubR1 (red) and anti-Aurora A (green) antibodies. DAPI (blue) staining reveals chromosomes. (C) Cytogenic analysis of ovarian cancer cell lines. Ten different metaphase chromosome spreads were analysed for their chromosome number. All three ovarian cancer cell lines are aneuploid. Diploid cells should have 46 chromosomes. (D) Representative metaphase chromosome spreads showing chromosome number aberrations in the three cell lines analysed. In OVCAR3, chromosome fusions, another important measure of CIN, were observed in OVCAR3 and are marked as arrows. Scale bars are marked. (E) Immunofluorescence analysis of three primary ovarian cancer cells (Ov_ca_01, Ov_ca_02, and Ov_ca_03). Images were taken and processed on a DeltaVision RT (Applied Precision) with × 1000 magnification. White scale bars 15 μm.

