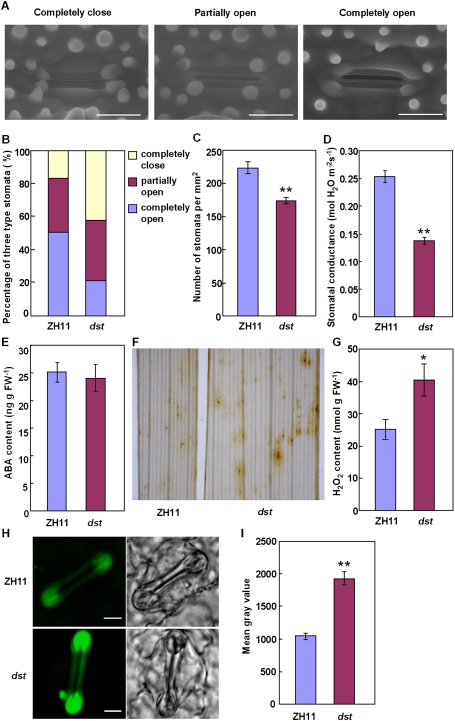
Figure 2.
H2O2 accumulation induces stomata closing in the dst mutant. (A) Environmental scanning electron microscopy images of three levels of stomatal opening. Bar, 10 μm. (B) The percentage of three levels of stomatal opening in ZH11 and dst mutant (n = 132 stomata for ZH11; n = 126 stomata for dst). (C) Stomatal density of the middle leaves of ZH11 and dst mutant (n = 10). Three random scopes were used in each repeat (356.20 μm × 356.20 μm in each scope). (D) Stomatal conductance of ZH11 and dst mutant (n = 12). (E) ABA content of ZH11 and dst mutant (n = 5 repeats, 16 plants in each repeat). (F) DAB staining in the seedling leaves of ZH11 (left) and dst mutant (right). (G) Quantitative measurement of H2O2 in the seedling leaves of ZH11 and dst mutant (n = 4 repeats, 16 plants in each repeat). (H) Examination of H2O2 production in the guard cell of ZH11 and dst mutant plant with H2DCFDA. Bar, 5 μm. (I) Quantitative analysis of H2O2 production in the guard cell of ZH11 and dst mutant plant (n = 104 stomata for ZH11; n = 99 stomata for dst). Data are presented as mean ± SEM in (C–E, G, and I). (*) P ≤ 0.05; (**) P ≤ 0.01, Student's t-test.

