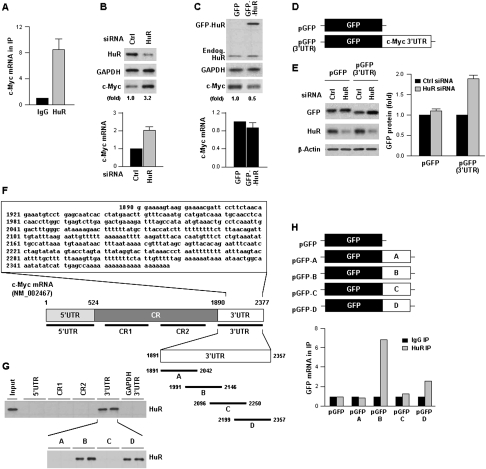
Figure 1.
HuR represses c-Myc expression. (A) HeLa cell lysates were subjected to RNP IP followed by RT–qPCR analysis to measure the enrichment of c-Myc mRNA in HuR IP compared with control IgG IP (Materials and Methods). (B) Forty-eight hours after transfection of HeLa cells with control (Ctrl) siRNA or HuR-directed siRNA, lysates were prepared to assess the levels of c-Myc, HuR, and loading control GAPDH by Western blot analysis (top) and the levels of c-Myc mRNA by RT–qPCR, using 18S rRNA for normalization (bottom). (C) Forty-eight hours after transfection with a control plasmid expressing GFP or a plasmid overexpressing HuR as fusion protein GFP-HuR, the levels of c-Myc, GFP-HuR, endogenous HuR, and GAPDH (top), and c-Myc mRNA (bottom) were measured as explained in B. (D) Plasmid pGFP-3′UTR was constructed by attaching the entire c-Myc 3′UTR after the GFP CR. (E) By 48 h after transfecting pGFP or pGFP-3′UTR, the levels of reporter GFP protein, HuR, and loading control β-actin (left) and GFP and chimeric GFP-3′UTR mRNAs (right) were measured as explained in B. (F) Sequence of the AU-rich c-Myc 3′UTR and schematic depiction of the 5′UTR, CR (CR1, CR2), and 3′UTR (A–D) biotinylated RNAs (assayed in duplicate) used for biotin pull-down analysis (shown in G) (Materials and Methods). (Input) Positive control; (biotinylated GAPDH 3′UTR) negative control. HuR in biotin pull-down samples was detected by Western blot analysis. (H) Constructs were prepared to express chimeric RNAs spanning the GFP CR and each of the four c-Myc 3′UTR segments shown in F; 48 h after transfection, binding of HuR to each chimeric RNA was tested by RNP IP followed by GFP mRNA detection by RT–qPCR. Values in A–C and E are the means ± SD from three independent experiments. The Western blotting data are representative of three or more experiments. Where indicated, c-Myc Western blotting signals were quantified by densitometry.

