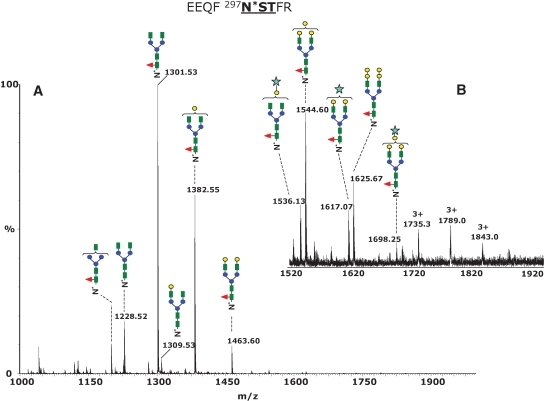
Fig. 3.
Positive ion nHPLC/ESI/MS of the Fc glycopeptides EEQFN*STFR from the mouse monoclonal antibody 6E10. (A) The MS spectrum averaged over the chromatographic window where glycopeptides eluted (30.6 min, average of 15 full MS scans). The glycan structures of the most abundant glycoforms are indicated above each ion. All ions are doubly charged. (B) Inset in the mass range m/z 1520–1920, showing low abundance di-, tri-, and tetragalactosylated glycoforms. The triply charged ions of m/z 1735.0, 1789.0, and 1843.0 show unusual oligosaccharide composition (see Discussion in the text). Color code: green square – N-acetylglucosamine; red triangle – fucose; blue circle – mannose; yellow circle – galactose; light blue star – N-glycolyl neuraminic acid.

