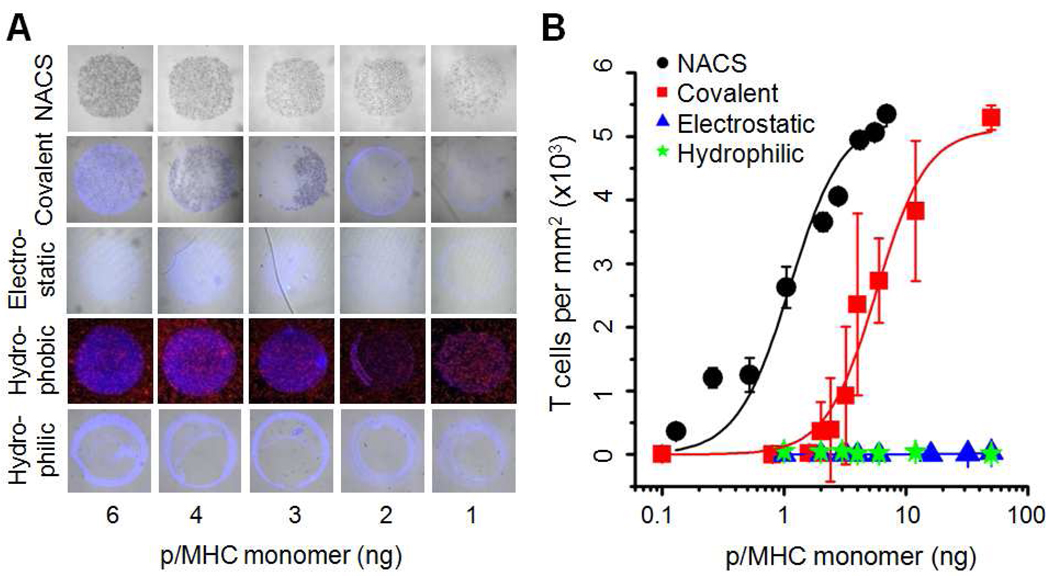
Figure 2. Comparison of NACS versus spotted p/MHC arrays.
(A) Brightfield and fluorescent images of Jurkatα-MART-1 T cells captured on various model substrates. (B) Quantification of T cell capture efficiencies (hydrophobic surface was excluded because signal:noise ≤ 1). Each data point was derived from three representative spots.

