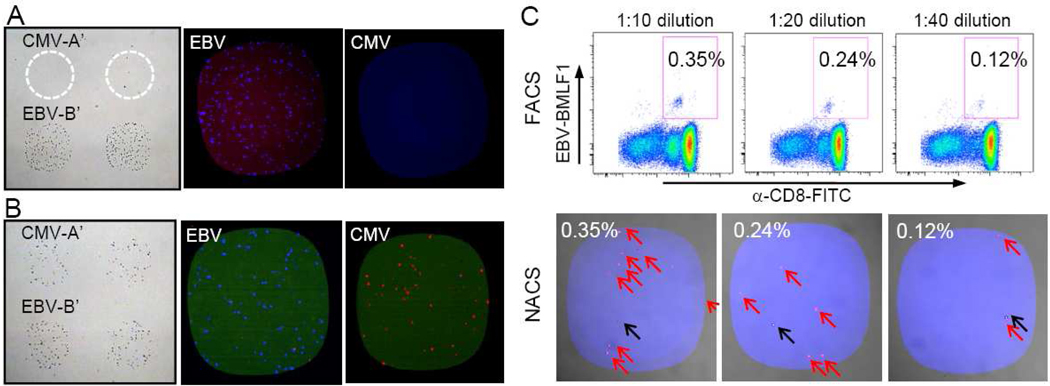
Figure 6. NACS sorting of endogenous primary human T cells specific for Epstein-Barr virus and Cytomegalovirus.
(A) CD8+ T cells from patient NRA 13 were captured on EBV p/MHC spots and no T cells were captured on CMV spots (left panel). The right two panels are representative images after the cells were stained with fluorescent EBV (blue) and CMV p/MHC tetramers (red). (B) T cells detected from a 1:1 mixture of NRA11 and NRA 13 (left panel) were verified to be specific for EBV and CMV (right panels). (C) Mixtures of ~0.4%, 0.2% and 0.1% EBV-specific T cell populations (upper panels) were detected via NACS (bottom panels). Populations of EBV-specific T cells are marked with red arrows and non-specific cells are marked with black arrows.

