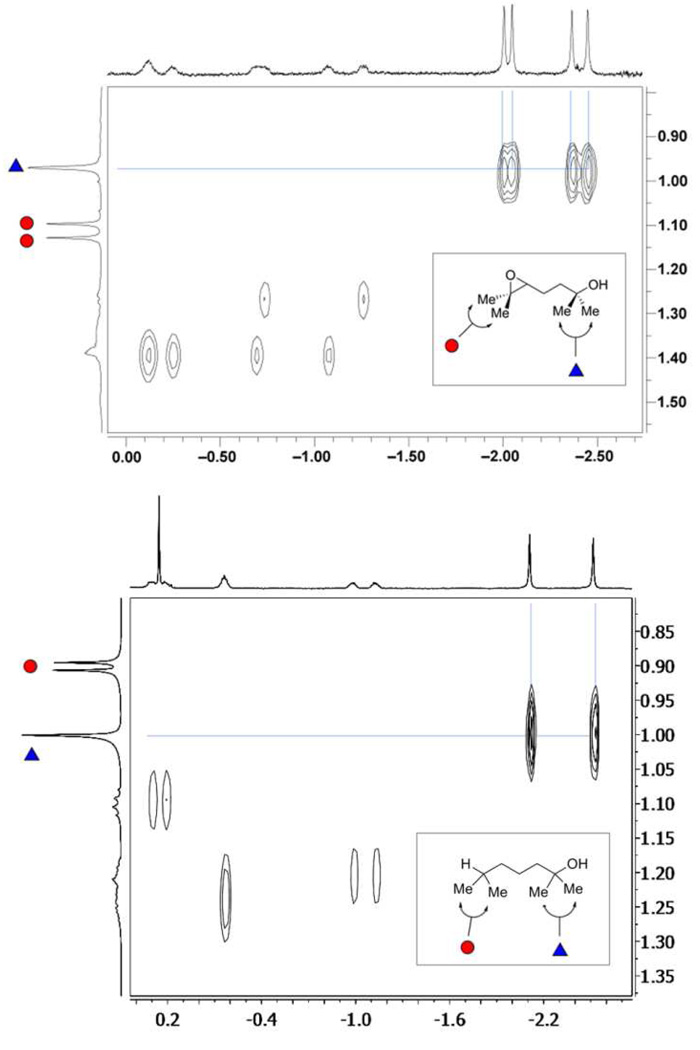
Figure 5.
Expansions of the 2D NOESY (600 MHz, mesitylene-d12) spectra of complexes 1•2 (top) and 1•6 (bottom) formed by treatment of cavitand 1 to a solution of either 2 or 6 at 300 K. This region shows chemical exchange cross-peaks between the singlet resonances from the methyl groups of the bound guest and one pair of geminal methyl groups of the unbound substrate (a spectrum of free guests 2 and 6 in mesitylene-d12 is shown in the vertical axis). Note that whereas the diastereotopic methyl groups at the epoxide terminus of 2 appear as two singlets at δ 1.13 and 1.15 ppm, the methyl substituents on the aliphatic region of 6 show up as a single doublet (J = 6.7 Hz) at δ0.90 ppm.

