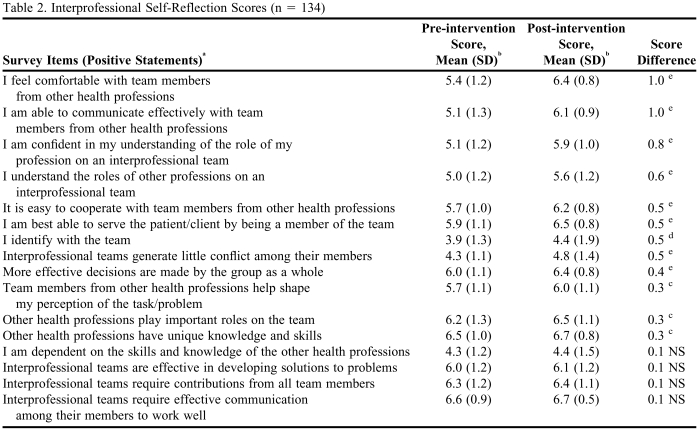
Table 2.
Interprofessional Self-Reflection Scores (n = 134)
aItems presented in descending order based on difference between pre-intervention and post-intervention test scores.
bEach survey item was anchored by a negative and positive statement and students were asked to indicate where they saw themselves on a 7-point continuum between the 2 statements. Due to space limitations, only the positive statements are presented in the table.
c p < 0.05
d p < 0.01
e p < 0.001

