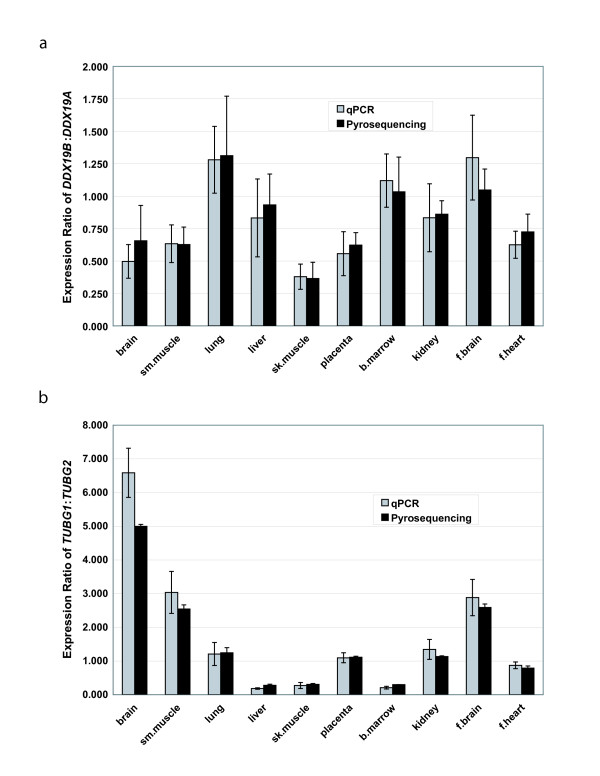
Figure 5.
Relative expression level comparisons with the gene pairs. Charts show the ratio of expression between a) DDX19A/B and b) TUBG1/2 in ten tissues. Expression values were obtained using both qPCR (grey bars) and pyrosequencing (black bars). An expression ratio of 1.0 would indicate equal expression.

