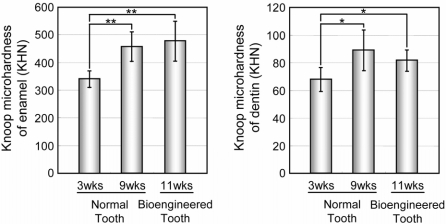
Fig. 2.
Assessment of the hardness of the bioengineered tooth. Knoop microhardness values of the enamel (Left) and dentin (Right) of the bioengineered tooth at 11-weeks post transplantation were compared with those of normal teeth from 3- and 9-week-old mice. Error bars show the standard deviation (n = 3). P < 0.001 (*) and <0.0001 (**) was regarded as statistically significant (t test).

