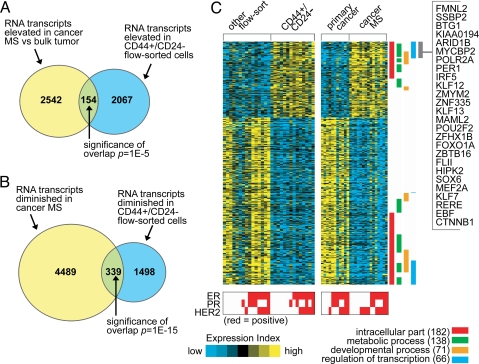
Fig. 1.
A gene transcription signature of breast cancer cells with putative tumor-initiating potential. (A) Venn diagram of the intersection between genes elevated in cancer mammospheres (MSs, rich in CD44+/CD24−/low cells) compared with primary cancers and genes elevated in CD44+/CD24−/low cells obtained from FACS assay (P < 0.01, fold change >1.5 for each comparison). P value for the overlap between the two gene sets by one-sided Fisher's exact test. (B) As with A but for genes lower in cancer MSs and genes lower in CD44+/CD24−/low flow-sorted cells. (C) Heat map of genes in the CD44+/CD24−/low-MS signature (from parts A and B). Each row represents a transcript; each column, a sample (yellow: high expression). Associations of the genes with selected Gene Ontology (GO) annotation terms are indicated. Genes in the indicated region are listed by name.

