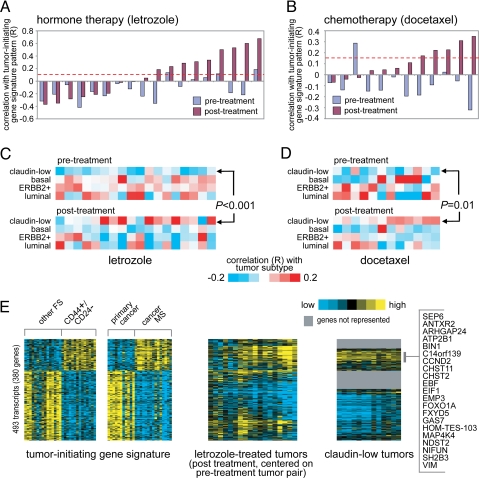
Fig. 3.
The CD44+/CD24−/low-MS gene signature is enriched in a subset of human breast tumors after treatment with hormone therapy or chemotherapy. (A) Correlation between the CD44+/CD24−/low-MS signature pattern and each of 36 human breast tumor profiles, representing 18 pairs before and after treatment with letrozole. R values above red dotted line are significant at P < 0.01. (B) Correlation between the CD44+/CD24−/low-MS signature pattern and each of 24 tumor profiles, representing 12 pairs before and after treatment with docetaxel. (C) Heat map of the correlations between each letrozole-treated tumor profile (part A) and the average expression for each of the four major Herschkowitz molecular tumor profile subtypes (claudin-low, basal, ERBB2+, luminal; averages centered on the mean centroid of the groups). P value comparing pretreatment and posttreatment R values for the claudin-low group by paired t test. (D) As with part C, but for the docetaxel-treated tumors (B). (E) Heat maps of the corresponding patterns of the CD44+/CD24−/low-MS signature genes within the letrozole posttreatment tumors (each tumor centered on corresponding pretreatment pair) and the Herschkowitz claudin-low tumors (centered on mean centroid of tumor groups). Gene ordering is the same across datasets.

