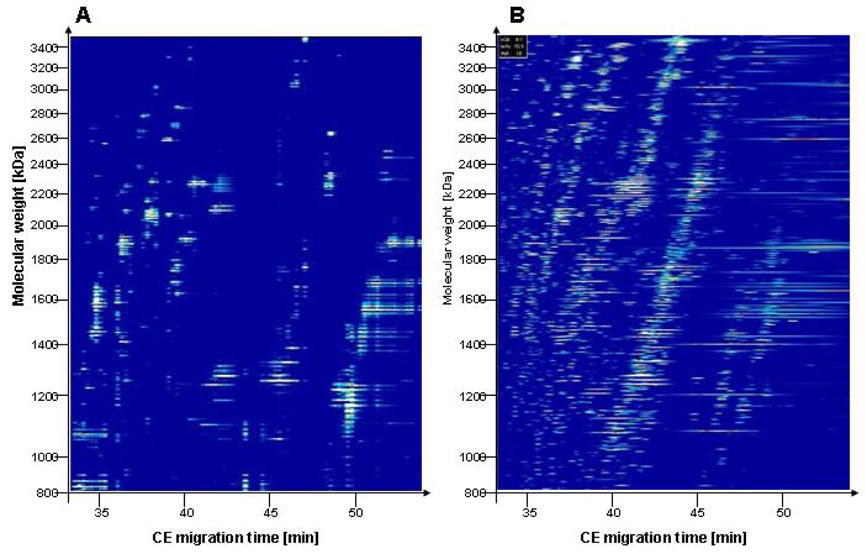
Figure 1.
Comparison of off-line and on-line CE-MS analysis of a urine sample. Data plots of CE-MALDI-TOF-MS (A) and of CE-ESI-TOF-MS (B) are shown. Molecular mass [Da] (logarithmic scale) is indicated on the left, and the migration time (in minutes) is indicated at the bottom. MALDI ionization enables detection of a low number of peptides in a complex sample with high confidence, whereas other signals appear suppressed, compared to ESI.

