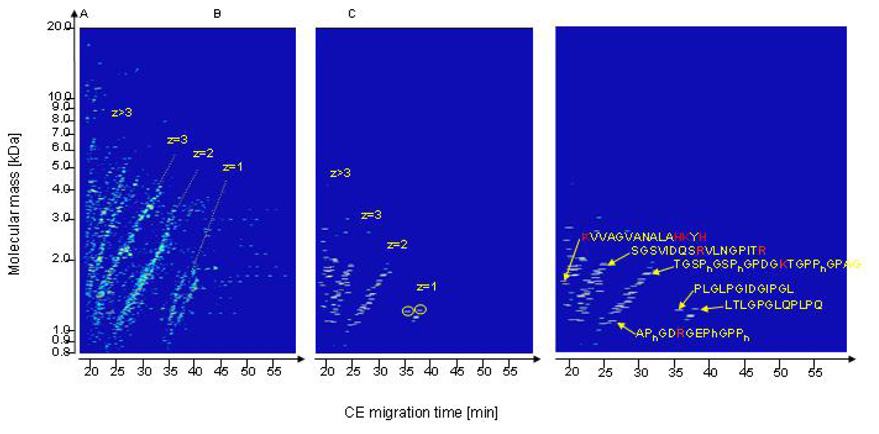
Figure 3.
Compiled CE-MS data from healthy volunteers. (A) Contour plot of the entire urine peptidome. The molecular mass (logarithmic scale) on the y-axis is plotted against normalized CE migration time on the x-axis. The arrangement of the analyzed peptides in distinct lines is obvious. (B) Contour plot of 107 identified polypeptides. The lines already observed in (A) result from the number of positive charges z (at pH 2.2). Peptides marked with circle: Collagen type VI alpha 4 fragment (PLGLPGIDGIPGL); 1217.702 Da; migration time: 34.03 min. Peptide marked with dashed circle: Insulin-like 3 fragment (LTLGPGLQPLPQ); 1232.713 Da; migration time: 36.19 min. (C) Correlation between the effective net charge, molecular mass, and the CE migration time for several examples of determined peptide sequences. Basic amino acids are colored in bold. Reprinted from (Zürbig et al., 2006) with permission.

